You need permission to view reporting for your store to see Reports on the home screen. If it’s missing, ask your store admin to check your role.
Open Reports
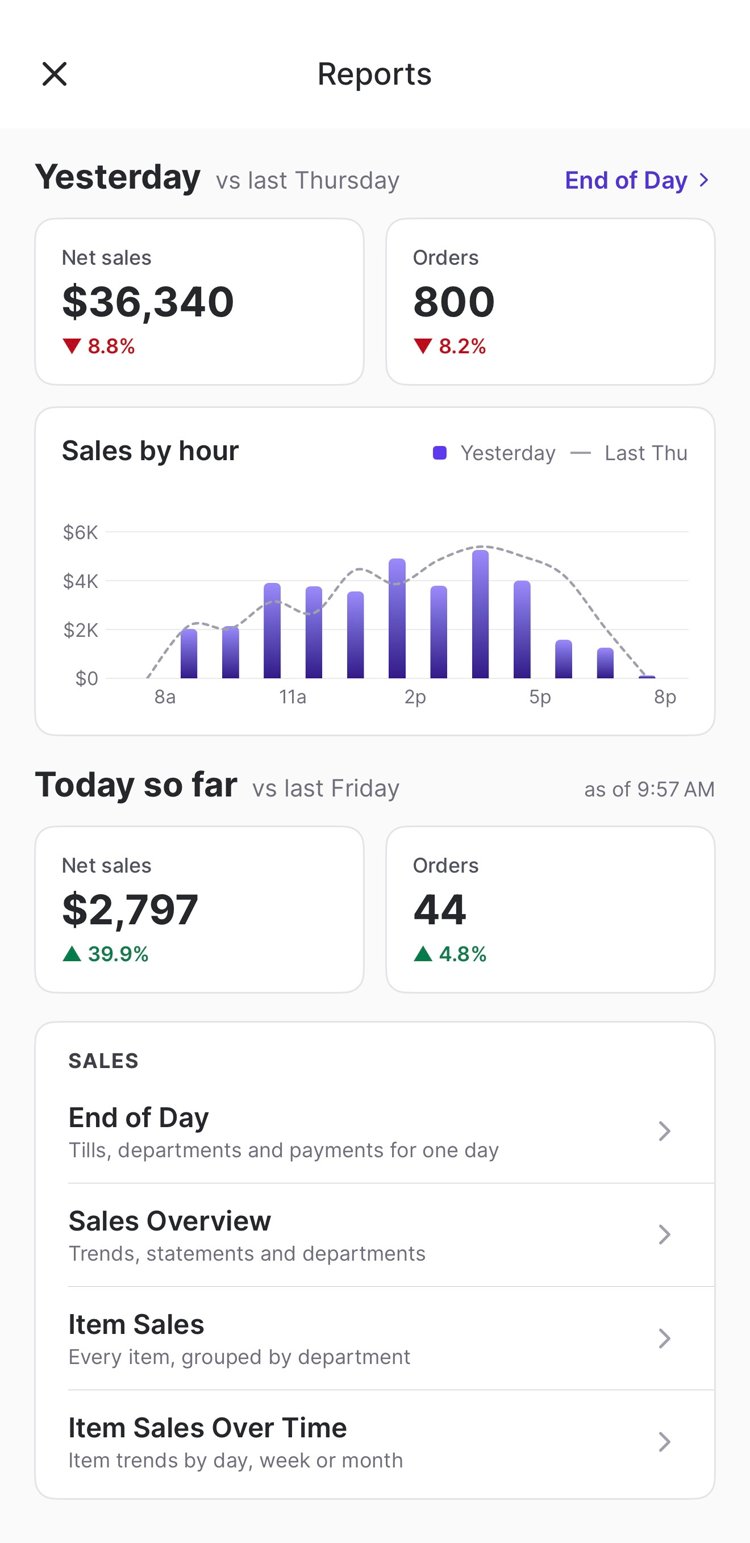
From the home screen, tap Reports. Depending on how your home screen is set up, it’s under Quick actions or All tools. To pin it to the top, tap Edit next to Quick actions. The top of the Reports screen shows how your store is doing compared with the same day last week. What you see first depends on the time of day:- Before noon: The day has barely started, so the screen opens with Yesterday: yesterday’s net sales, orders, and sales by hour. Today so far sits below it with just net sales and orders. To see yesterday’s full report, tap End of Day next to Yesterday.
- From noon on: The screen opens with Today so far: today’s net sales, orders, and sales by hour.
Reports you can open
These reports use the same data as the Back Office. For the full report with every column and export option, use Reports in the Back Office.
End of Day
- Tap End of Day.
- Use the arrows or tap the date to pick a day. Until 6:00 PM store time, the report opens on yesterday so you can close out the previous day.
- Scroll through the sections:
- Net sales and Orders, compared with the same day last week, and Sales by hour.
- Sales summary and Cash summary. Tap a line with an arrow, like Gross Sales, to break it down.
- Tills: One row per lane with its hours, cashiers, and whether it was balanced, over, or short. Tap a till to see its drawer figures, like starting amount, cash back, pay ins and pay outs, expected, and actual.
- Department sales: Quantity, item sales, discounts and rewards, deposits, refunds, and margin by parent department and department.
- Payments: Totals by cashier or by lane. Use the toggle to switch between them.
- Inventory shrink and Inventory adjustments by department, at current cost.
Sales Overview
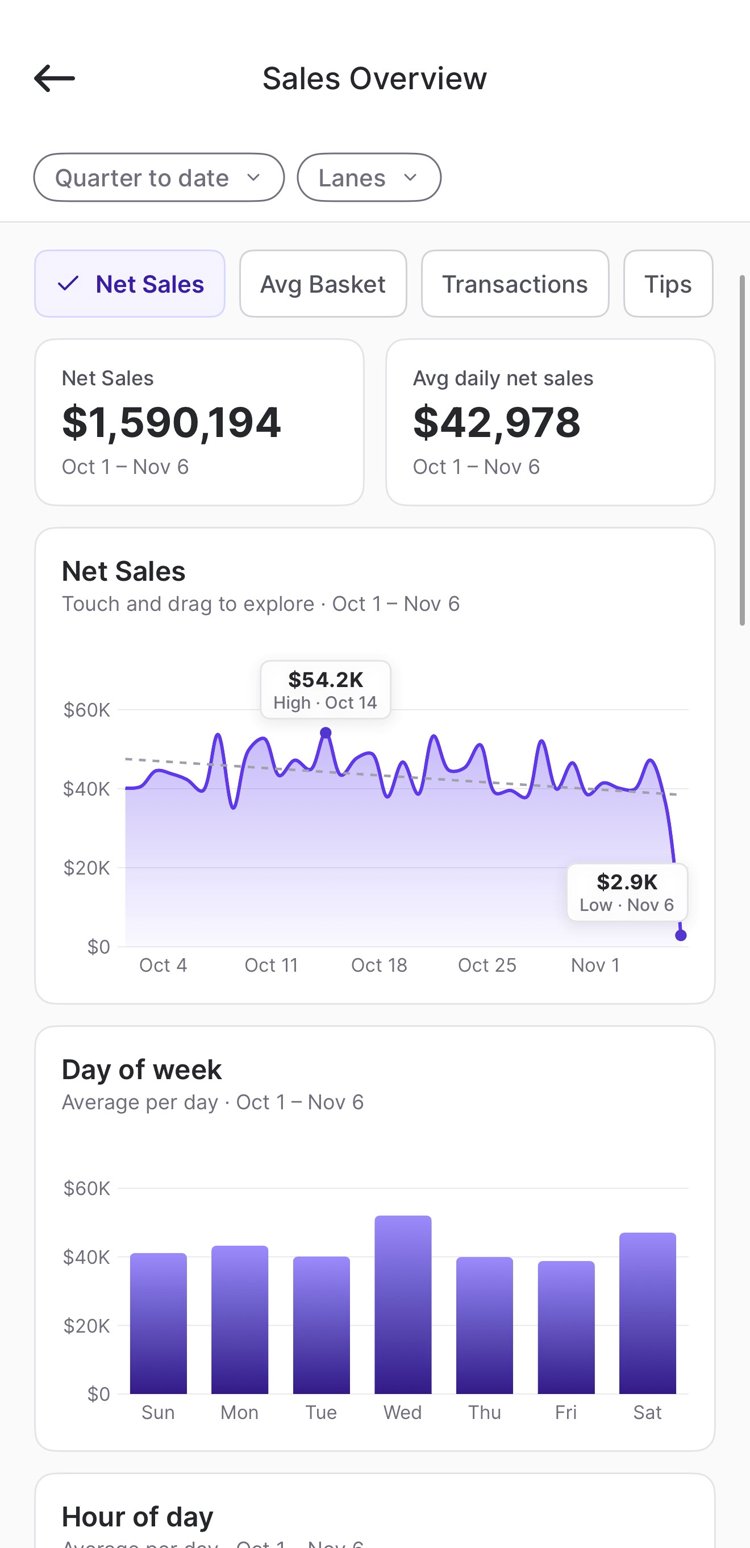
- Tap Sales Overview.
- Set the date range and lanes at the top.
- Tap a metric chip to switch the charts between Net Sales, Avg Basket, Transactions, and Tips.
- Touch and drag across a chart to see the value for any point. On the daily trend, tap View in the callout to drill into that day.
Item Sales
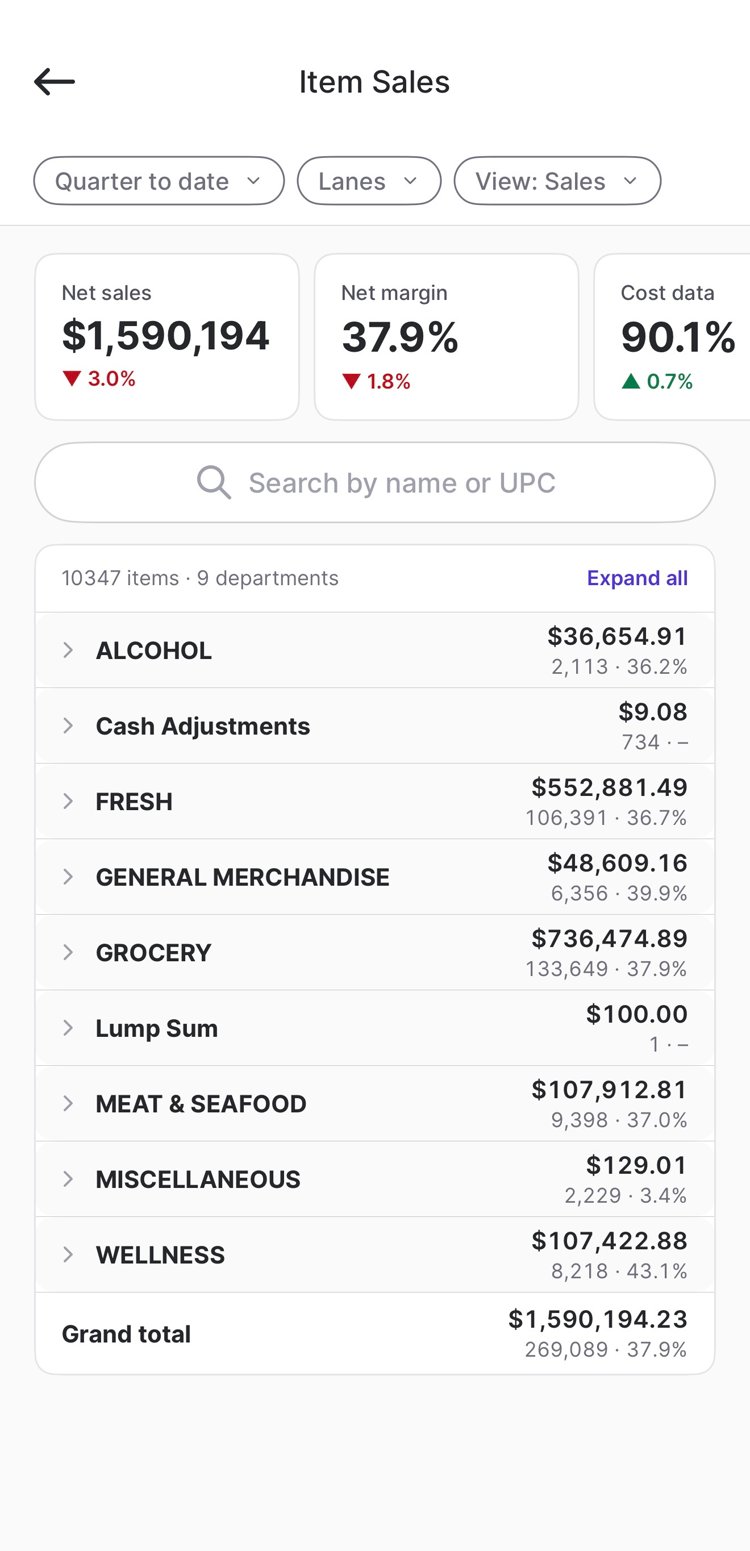
- Tap Item Sales.
- Set the date range and lanes, then choose a View:
- Sales: Items that sold in the date range.
- Unsold products: Active products with no sales in the date range, with their retail price and on-hand quantity.
- Items are grouped by parent department, then department. Tap a group to expand it, or tap Expand all.
- Tap an item to see all of its sales figures.
Item Sales Over Time
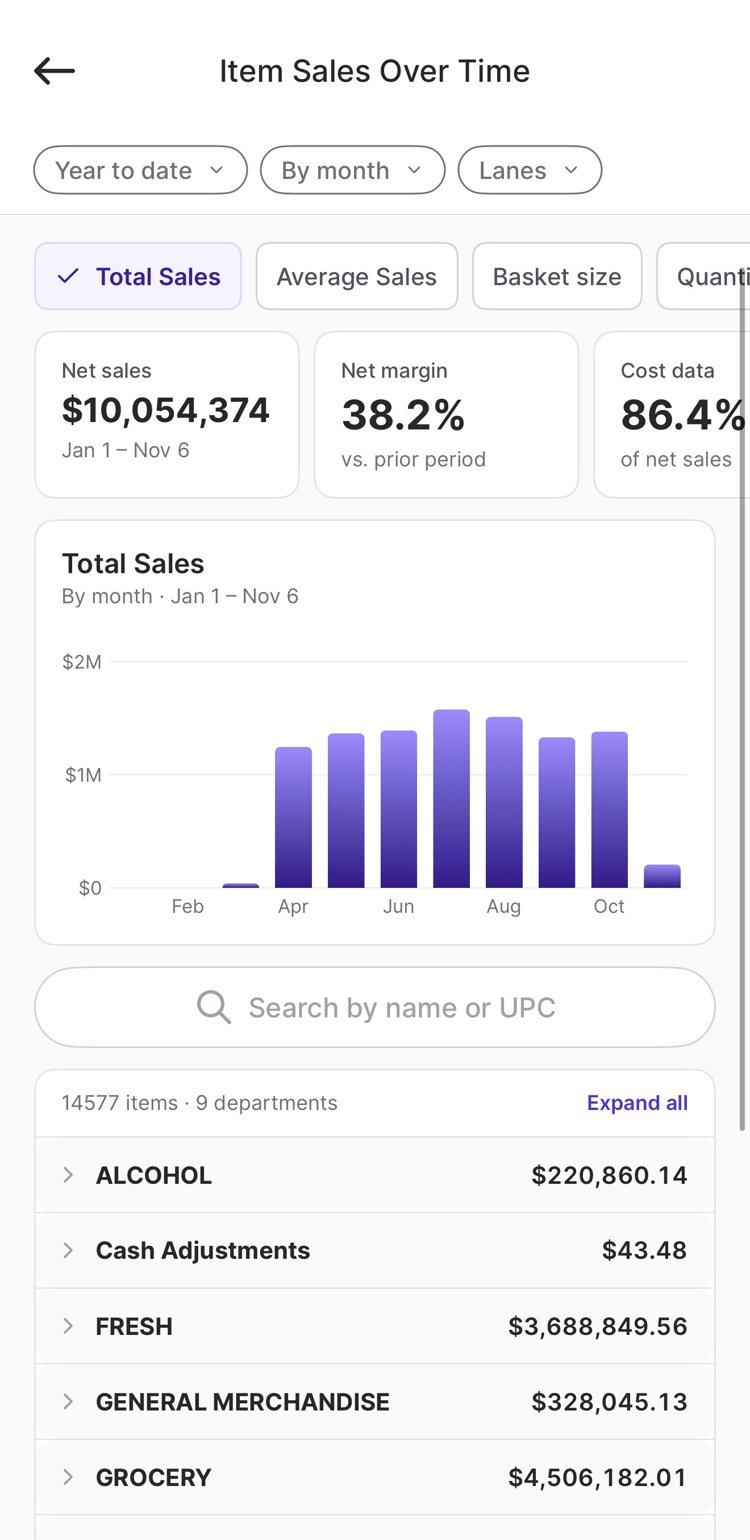
- Tap Item Sales Over Time.
- Choose a metric: Total Sales, Average Sales, Basket size, Quantity, Weight, COGS (Cost of Goods Sold), Margin ($), or Net Margin %.
- Set the date range and lanes, and use By to group results by day, week, month, hour of day, or day of week. The report opens on year to date by month.
- Touch and drag across the chart to see each period’s value. Tap View in the callout to see the items for that period.
- Tap an item in the table to see its own trend for each period.