Opening the Item Sales report
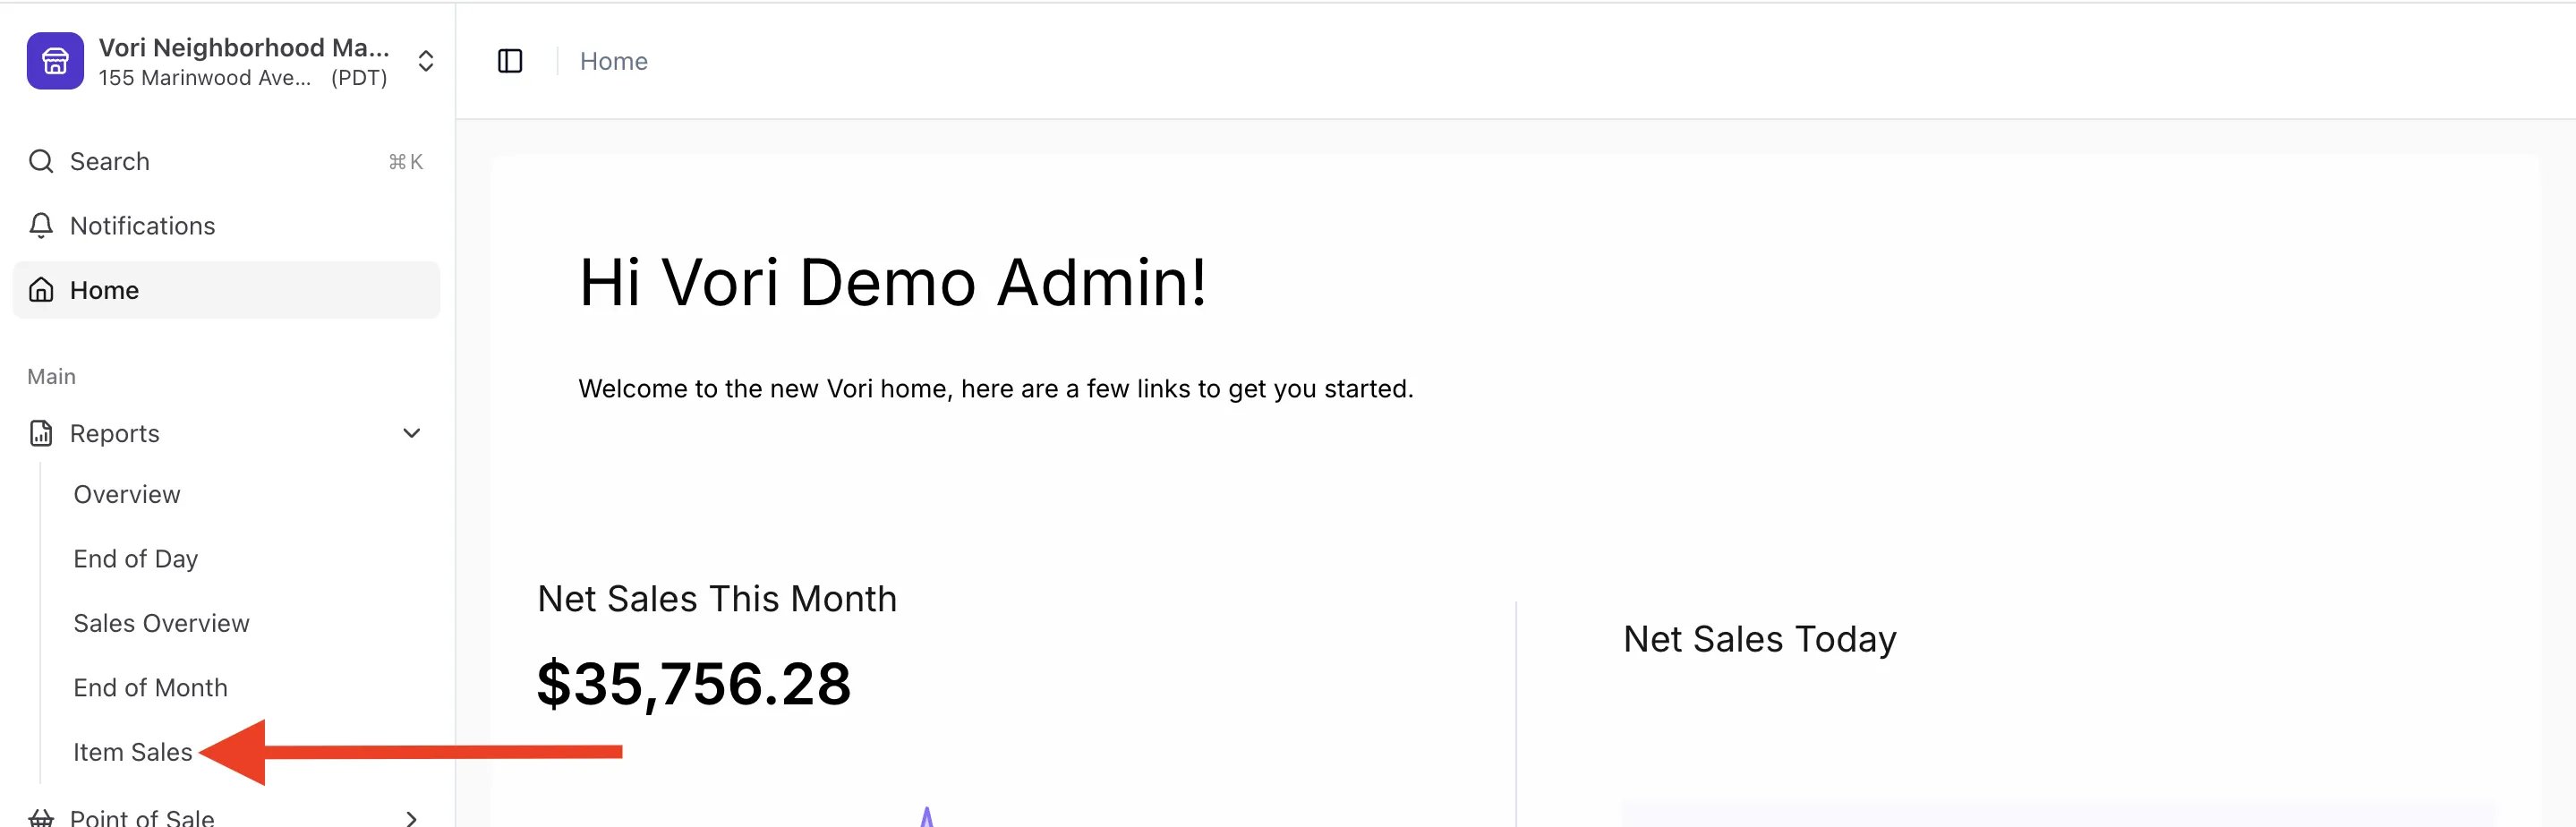
- In Back Office, select Reports on the lefthand menu.
- Within the Reports dropdown, select the Item Sales report.
Setting a date range for the report
On the top left section of the Item Sales report, set the desired date range for the report.
Setting groupings for the report
Directly above the Item Sales table at the bottom of the report, make sure the following settings are made:- Group: Department
- **Sub-Group:**Sub-Department
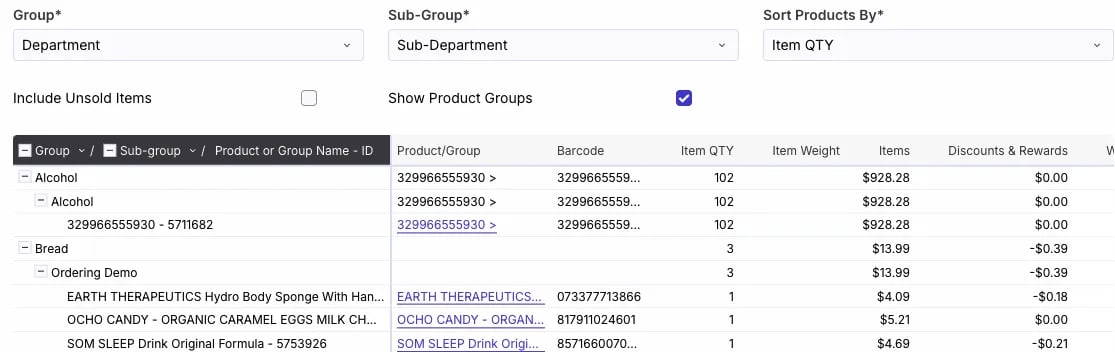
- Sort Products By:
- Item QTY: Sort the products within each sub-department in descending order with the highest item quantity sold at the top.
- Item Weight: Sort the products within each sub-department in descending order, placing the items with the highest total weight sold at the top.
- Net Sales: Sort the products within each sub-department in descending order, with the items that generated the highest total sales revenue listed at the top.

Reviewing the report
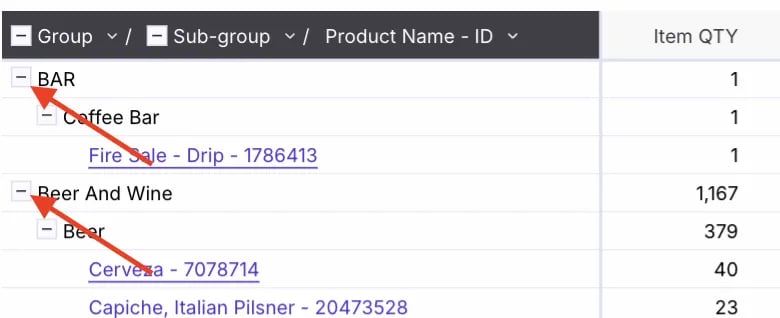
After the report is generated and filtered, scroll to the Item Sales table at the bottom of the page.- Click the minus (-) sign next to any Sub-Department name to collapse product rows into a single sales total for that sub-department.
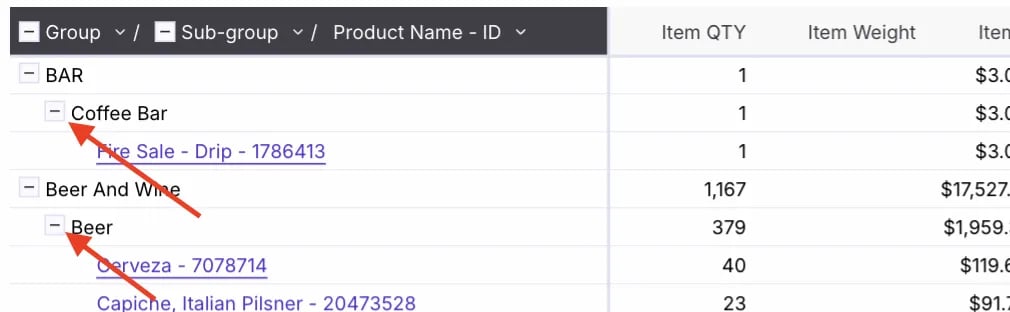
- The same can be done at the Department level to view totals without sub-department or item-level detail.
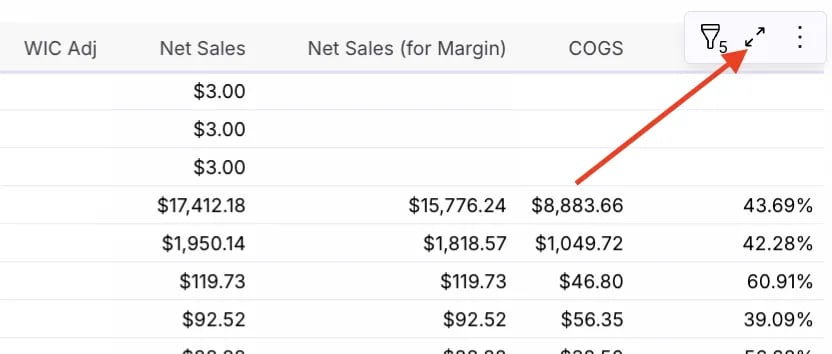
- Hover over the top-right corner of the table and click the expand icon to enlarge the view and display all product details, including sales quantity, item weight, and net sales.