

Accessing the Report
You can find all Double Up Food Bucks data within the Finances section of Vori Back Office.- Log in to Vori Back Office.
-
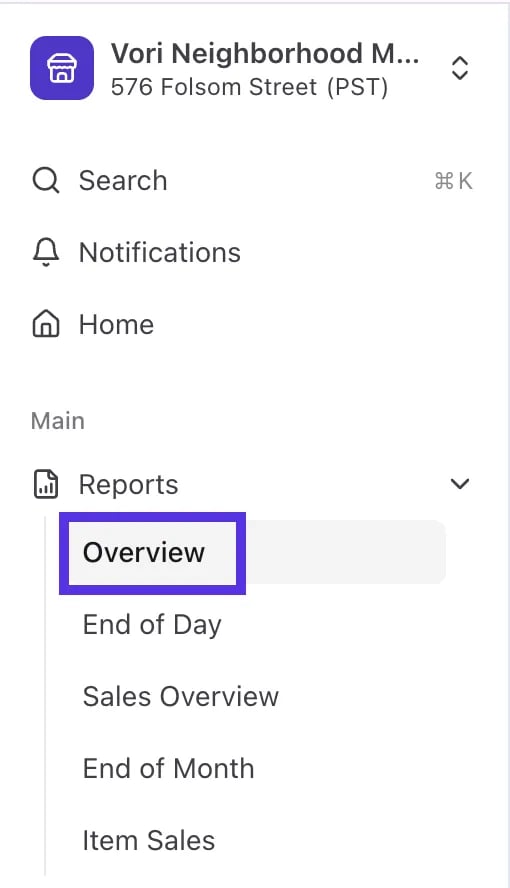
Click Reports in the left navigation menu.
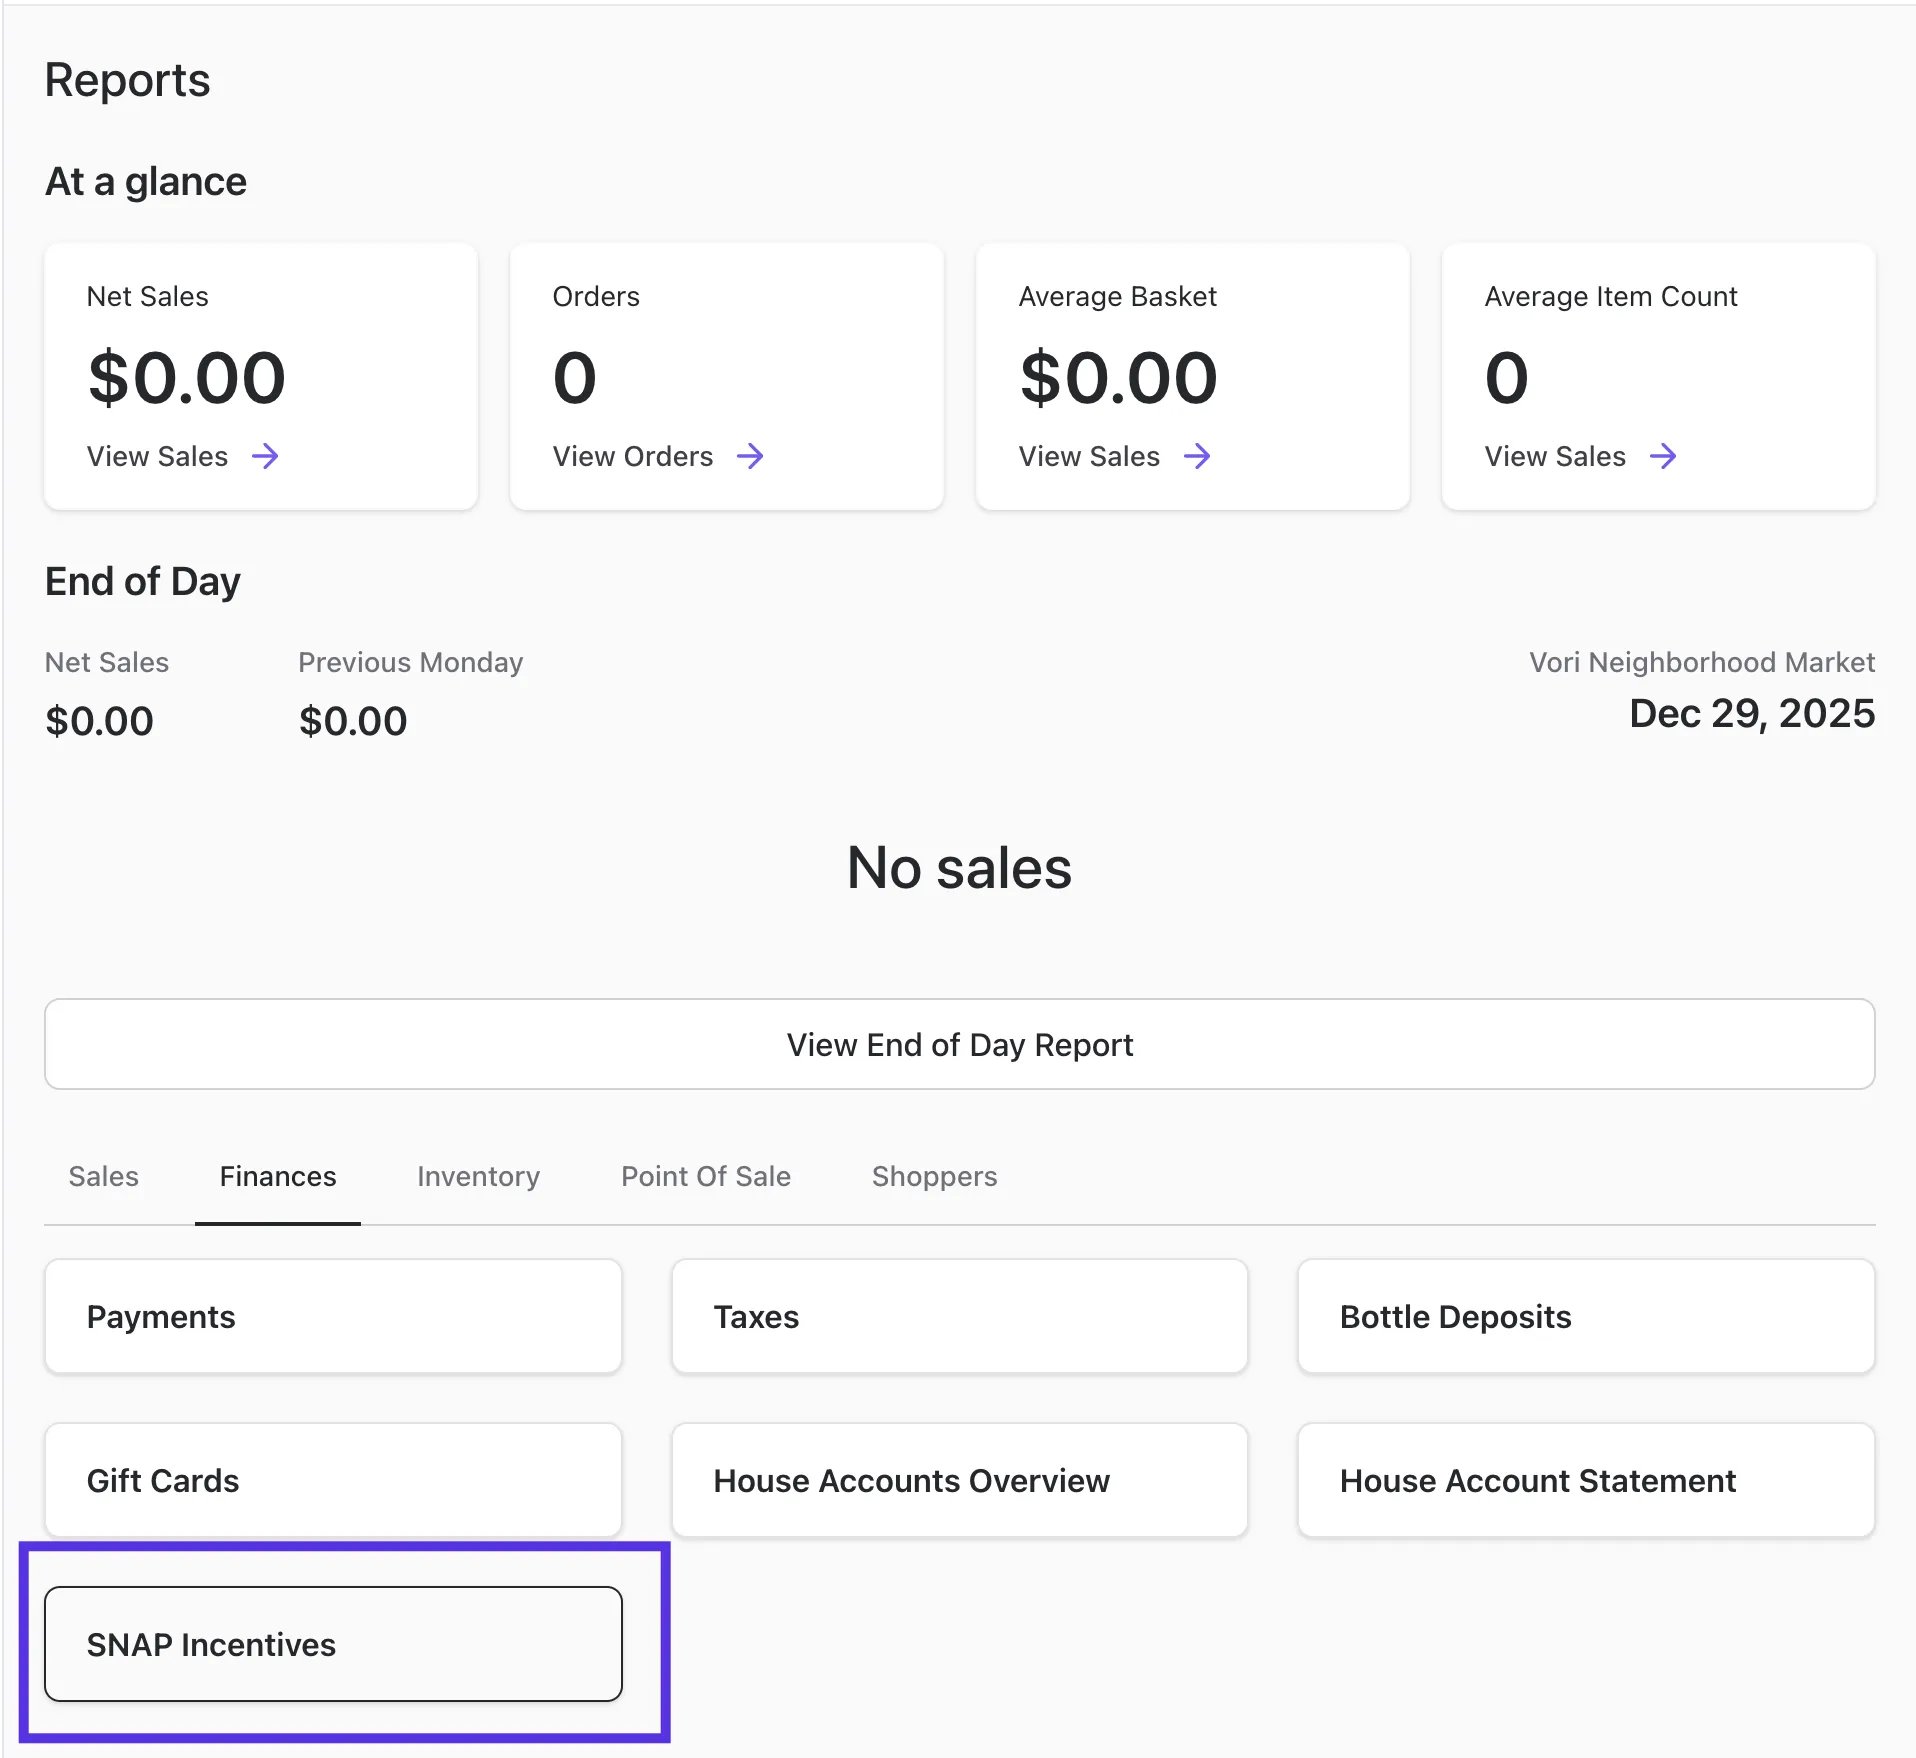
- Select Finances.
-
Click SNAP Incentives.
-
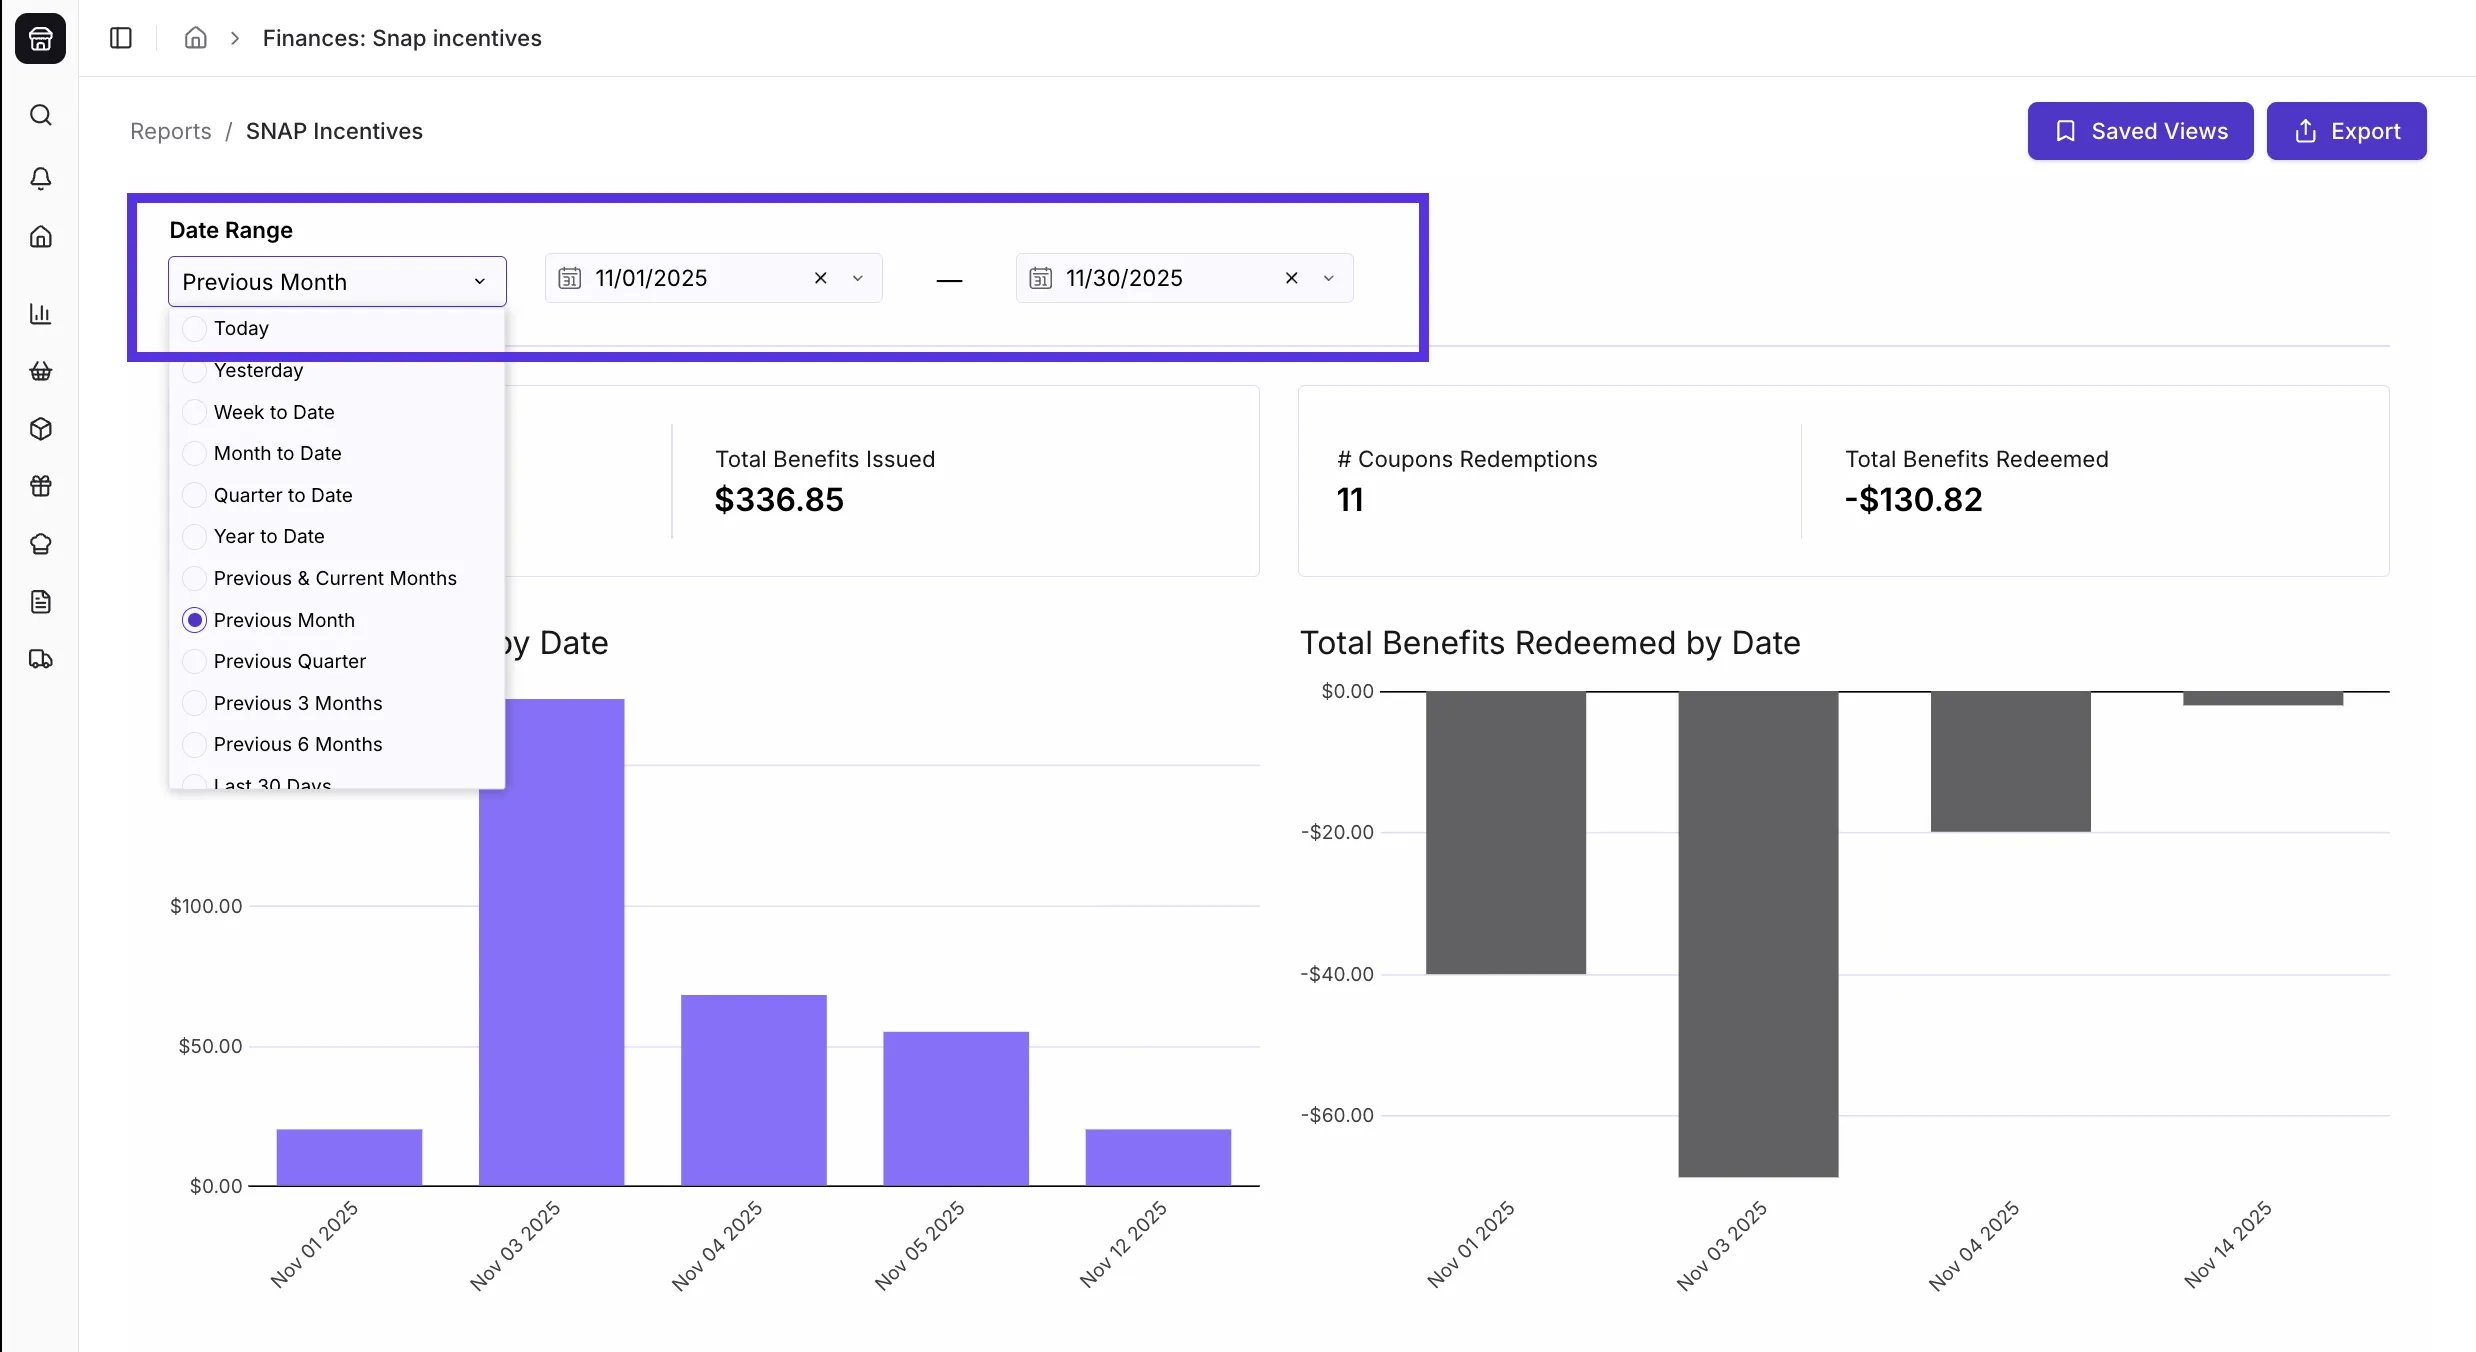
Use the Date Range selector at the top left to choose the period you want to analyze (e.g., “Last 30 Days” or “Previous Month”).
-
Expand any element: Select View full screen in the top-right corner of any figure or chart to expand it. Bar and pie charts also have an icon to switch the chart to a table.
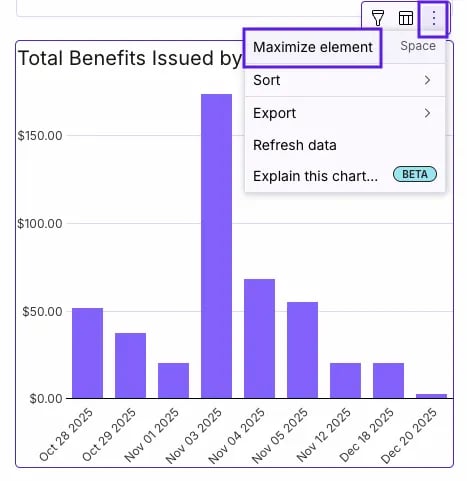
- Export Data: Use the three-dot (⋯) More actions menu → Download as CSV to export a figure’s data, or switch a chart to a table and download that. You can also export the whole report as a PDF (portrait, landscape, or full width).
Coupon Issuance & Redemptions
This section tracks the coupons generated for your shoppers at the register.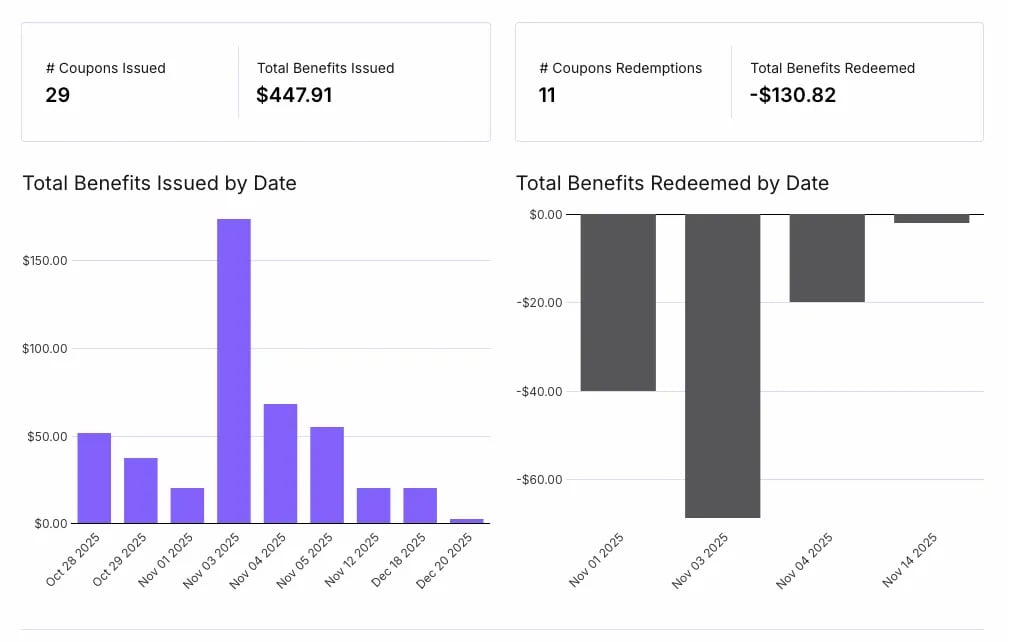
Where can I find how many Double Up Buck coupons have been issued?
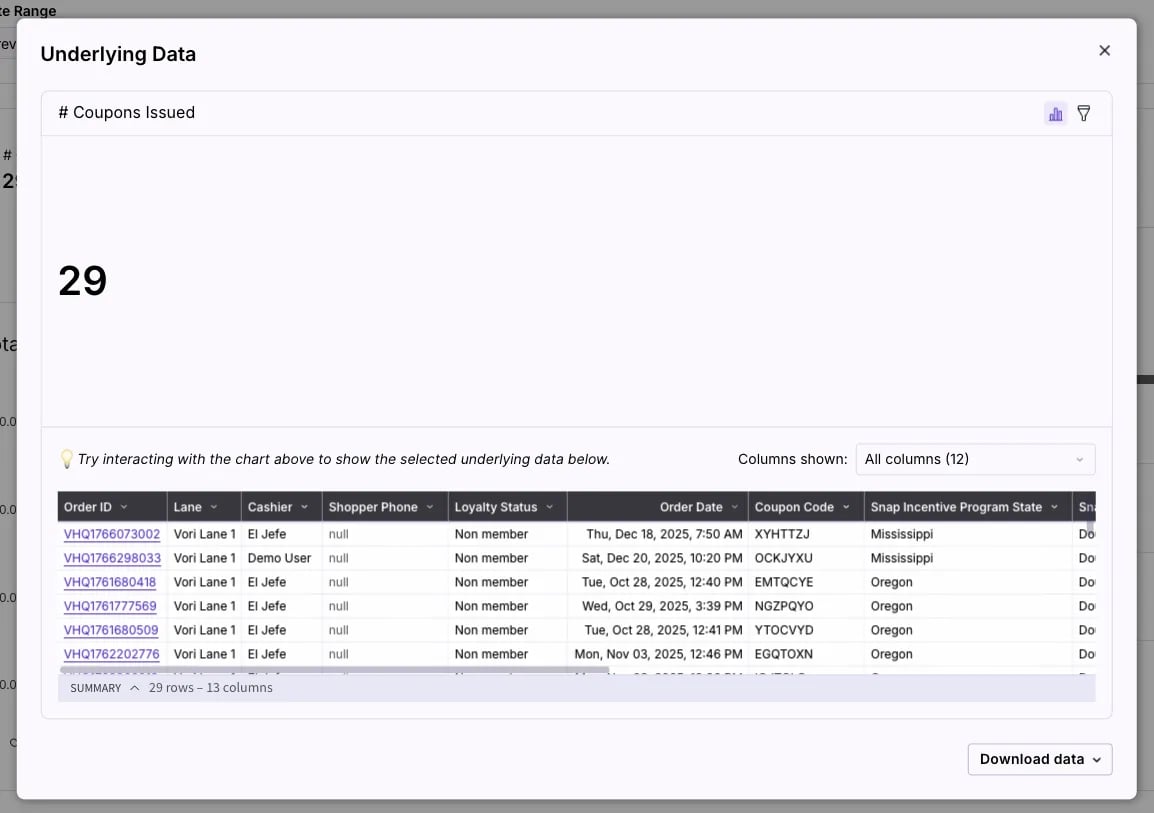
- You can find this in the # Coupons Issued card at the top left of the dashboard. This number represents the total count of coupons generated for shoppers during your selected date range.
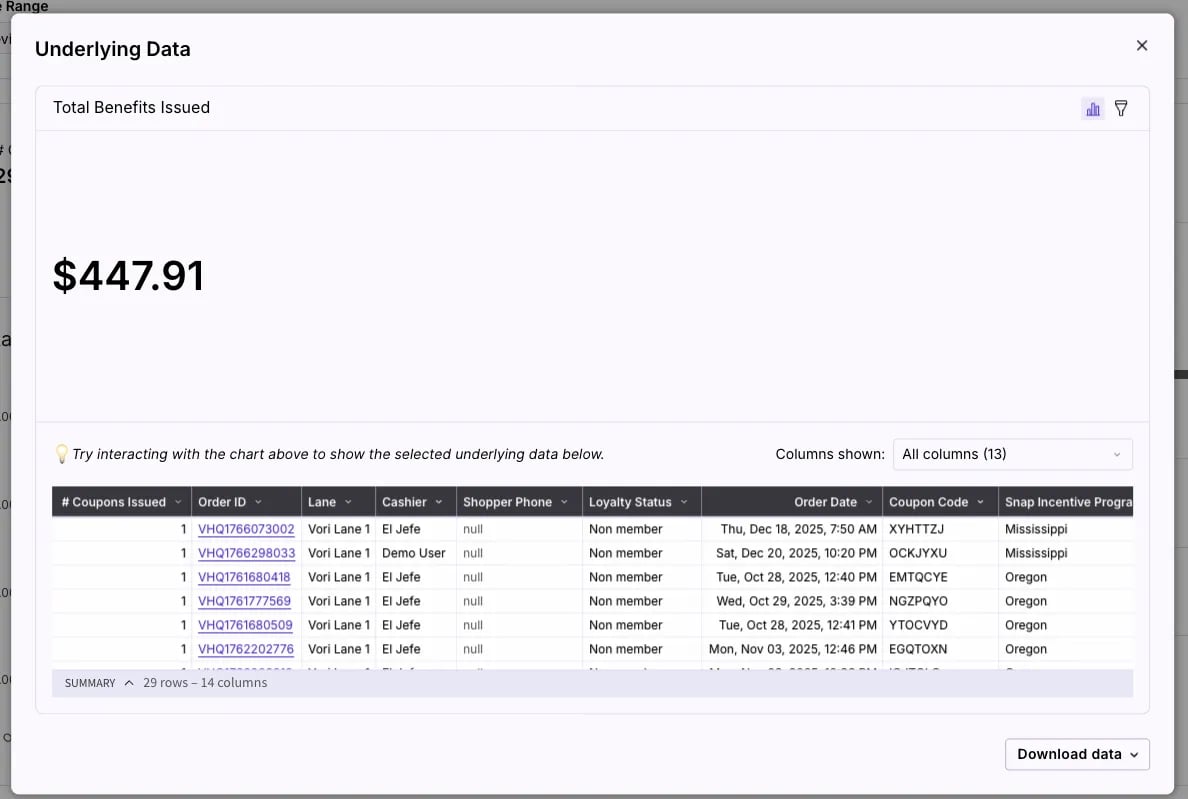
- Next to it, Total Benefits Issued shows the total dollar value of those coupons.
Where can I see how many coupons shoppers have redeemed?
-
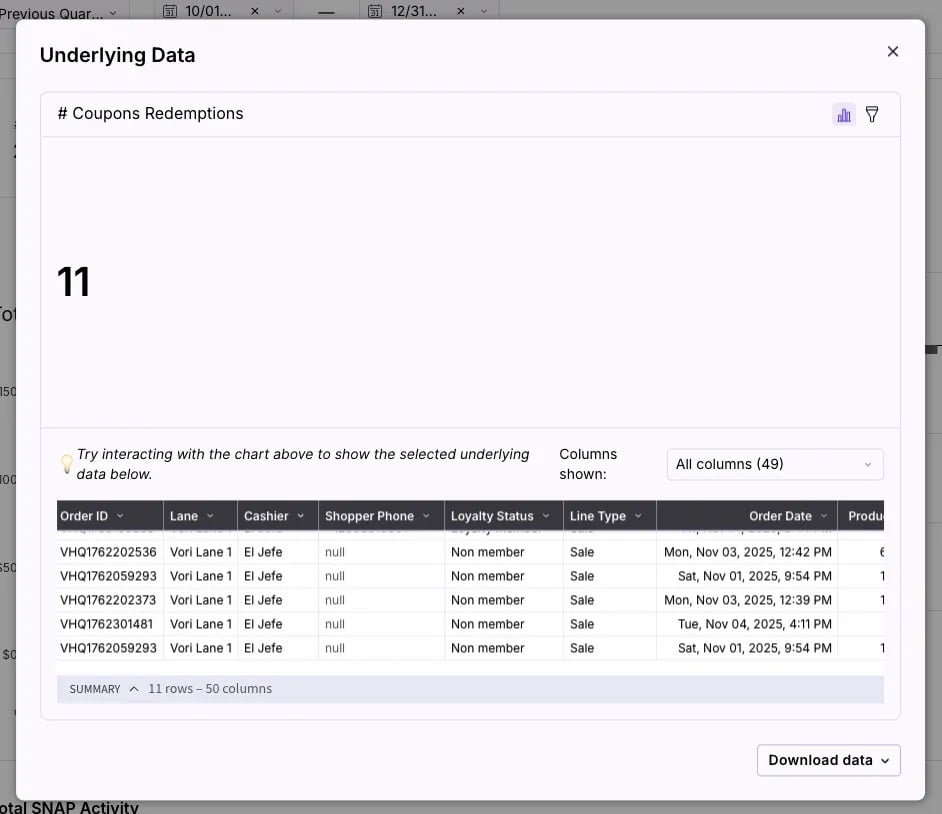
Look at the # Coupons Redemptions card on the top right. This tells you how many times shoppers have used a coupon at the register.
-
The Total Benefits Redeemed card shows the total dollar amount of discounts given.
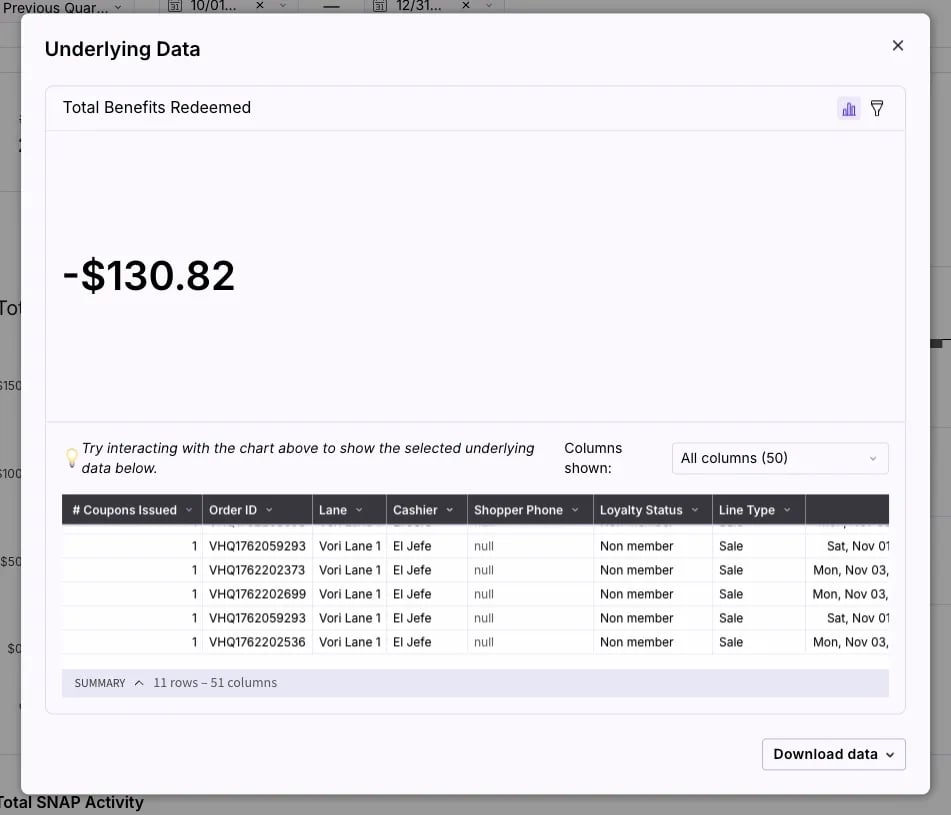
Total SNAP Activity
This section helps you compare your incentive program performance against your overall SNAP sales volume.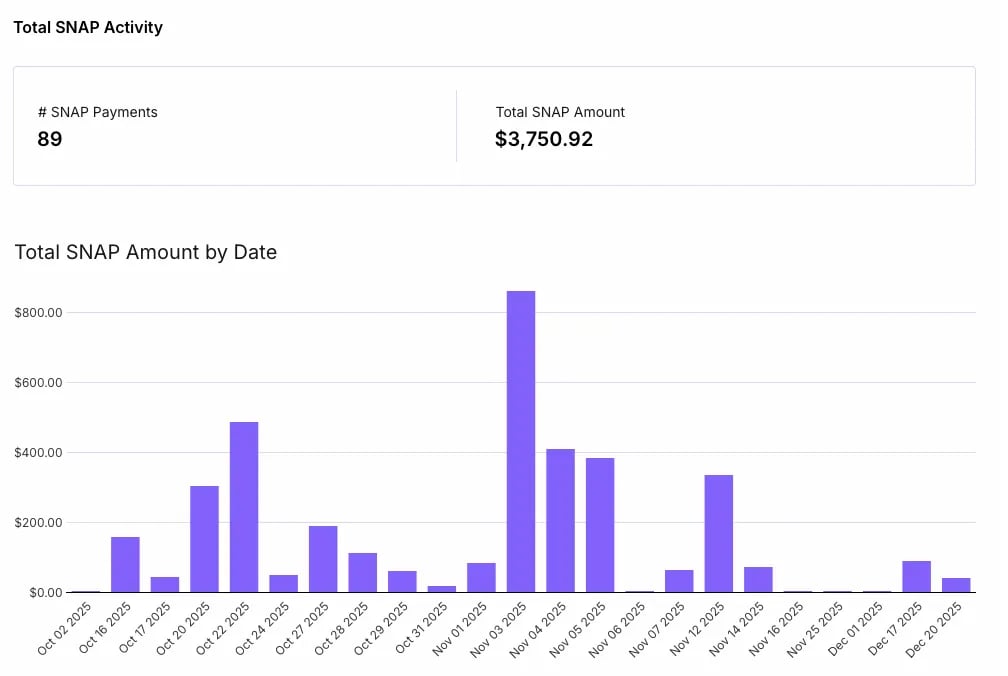
Where can I see my store’s total SNAP sales volume?
- Scroll down to the Total SNAP Activity section to see:
-
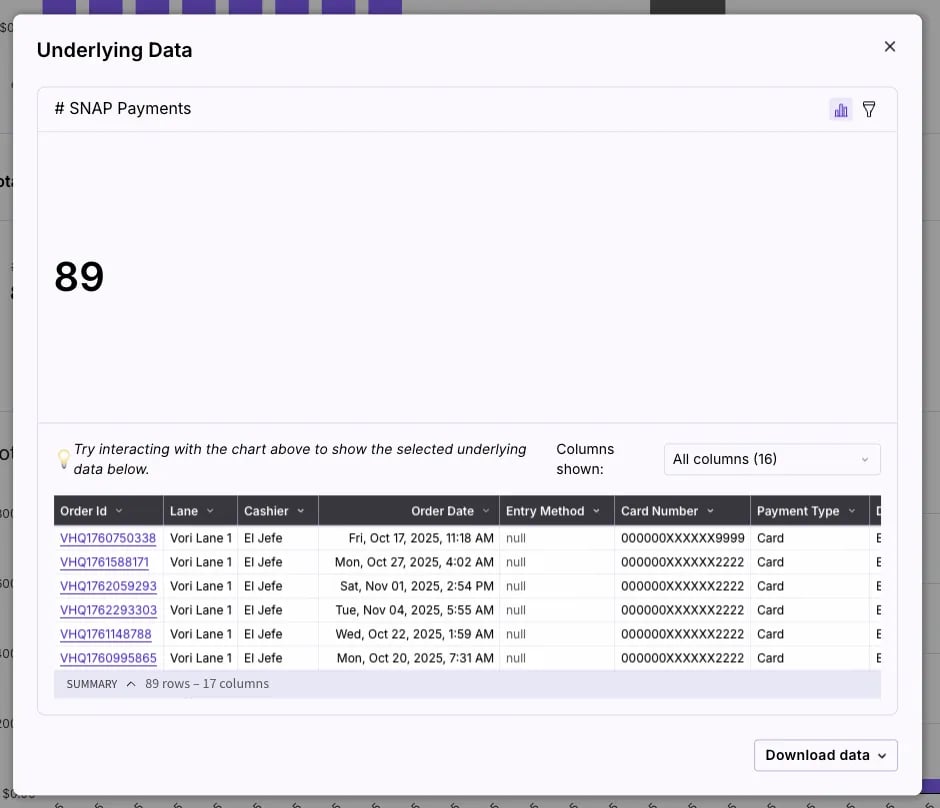
# SNAP Payments: The total count of EBT SNAP transactions in the selected period.
-
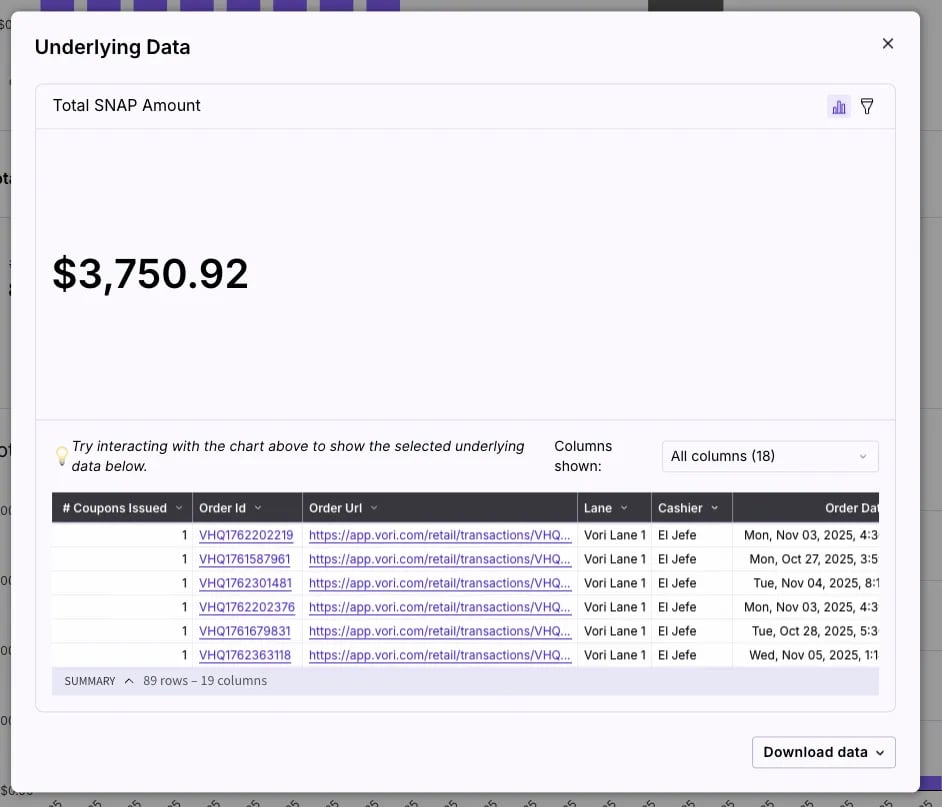
Total SNAP Amount: The total revenue collected from those SNAP payments.
-
# SNAP Payments: The total count of EBT SNAP transactions in the selected period.
What info can be found in the underlying data?
Click the three dots (⋯) on the Total SNAP Amount by Date chart to reveal More actions, then select View underlying data to audit individual EBT payments with data such as:- Payment Methods: Confirm the Payment Type (EBT/eWIC) and Entry Method (e.g., Card or Manual).
- Card Security: View the masked Card Number, Card Brand, and Online/Offline status.
- Transaction Status: Verify the payment Status (e.g., Paid) and the exact Authorized Amount collected.