

Data allows you to make smarter buying decisions. Use the Movement and Reporting tools to see the bigger picture of your store’s health and spot trends.
Vori’s reporting tools give you immediate visibility into your current stock levels and historical movements. Use the Inventory Levels, Inventory History, Shrink, and Inventory Manual Counts reports to track performance across every department, spot trends early, and protect your margins.Accessing Inventory Reports
To view the health of your inventory, navigate to the Reports section in the Back Office.- Select Reports from the main menu, then click Sales Overview.
-
Scroll to the bottom of the page and select the Inventory tab.
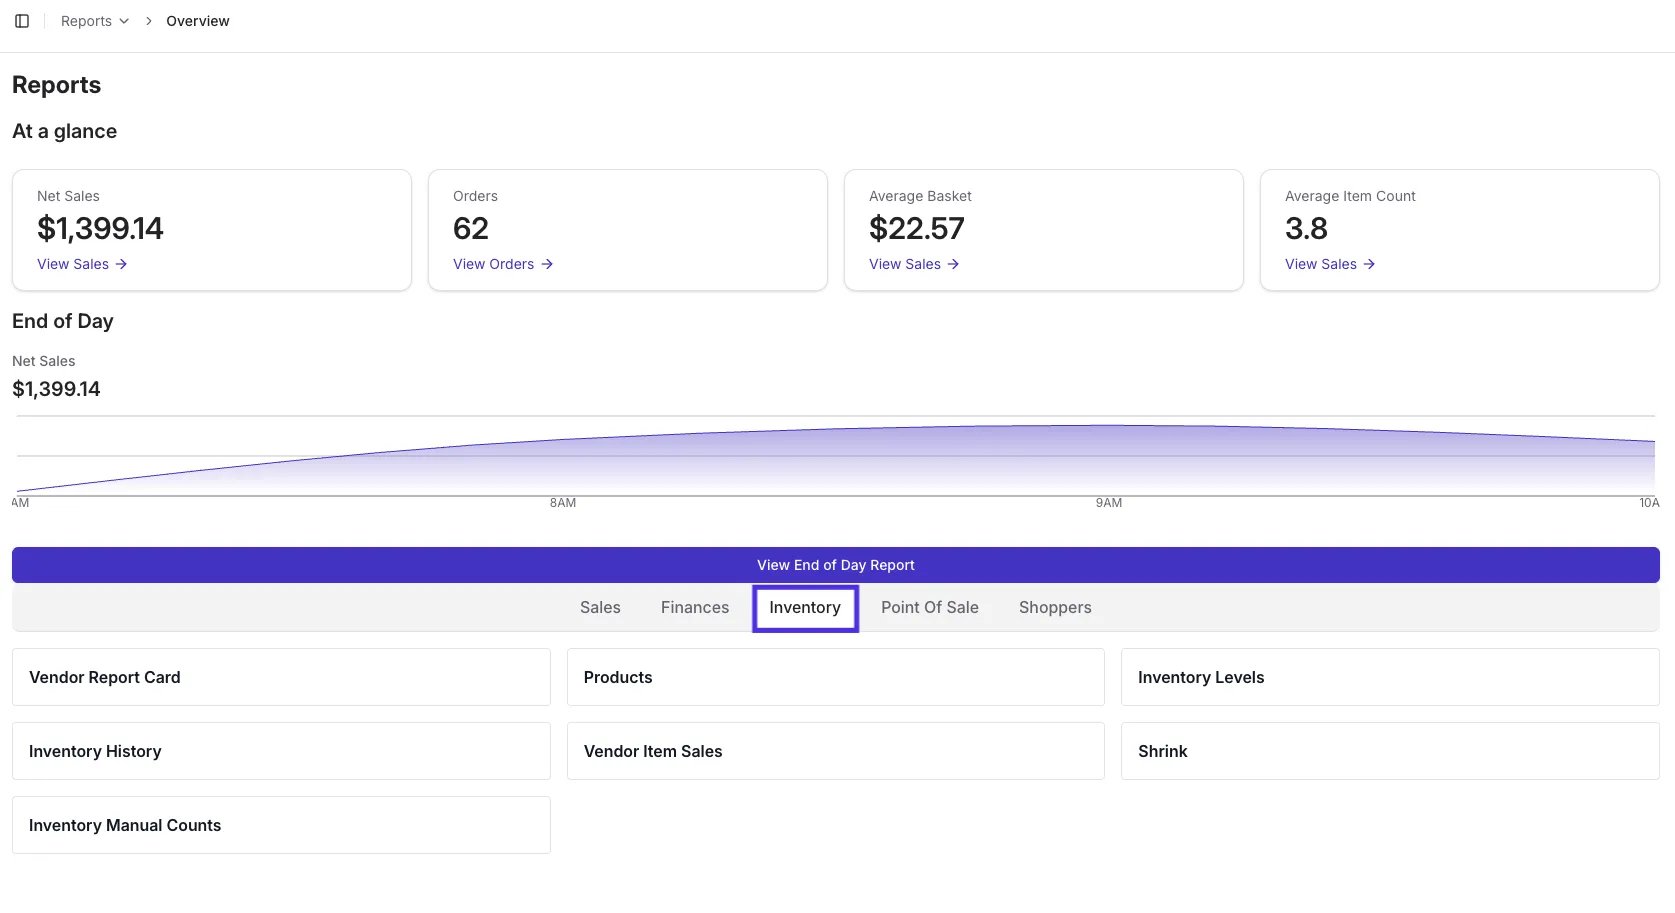
- From here, you can select the specific report card you wish to view: Inventory Levels, Inventory History, Shrink, or Inventory Manual Counts.
- Expand any element: Select View full screen in the top-right corner of any figure or chart to expand it. Bar and pie charts also have an icon to switch the chart to a table.
- Drill into the details: Click the three dots (⋯) in the top-right corner to reveal More actions, then select View underlying data to see the individual product and transaction records behind a figure. Each row links to its transaction and product.
- Export your results: Use the three-dot (⋯) More actions menu → Download as CSV to export a figure’s data, or switch a chart to a table and download that for the full breakdown. You can also export the whole report as a PDF (portrait, landscape, or full width) or schedule a PDF export by email.
Inventory Levels Report
This report gives you an immediate financial snapshot of your shelves so you can balance your inventory investment.Where can I find a report on what products have an inventory count vs. what products do not?
-
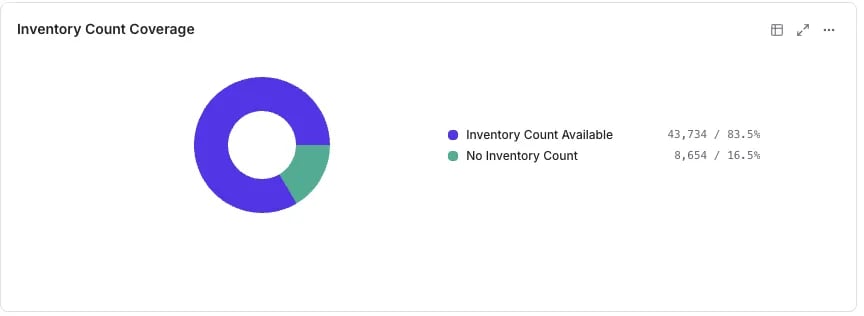
The Inventory Count Coverage chart shows you exactly what percentage of your store has a tracked count versus items uncounted.
Where can I quickly see what percentage of my tracked items are out of stock?
-
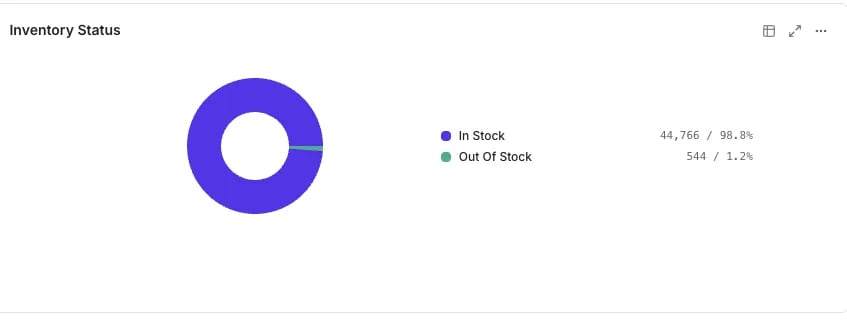
The Inventory Status chart helps you identify what percentage of your tracked items are currently In Stock versus Out Of Stock.
Where can I see the total financial value of the stock currently sitting on my shelves?
-
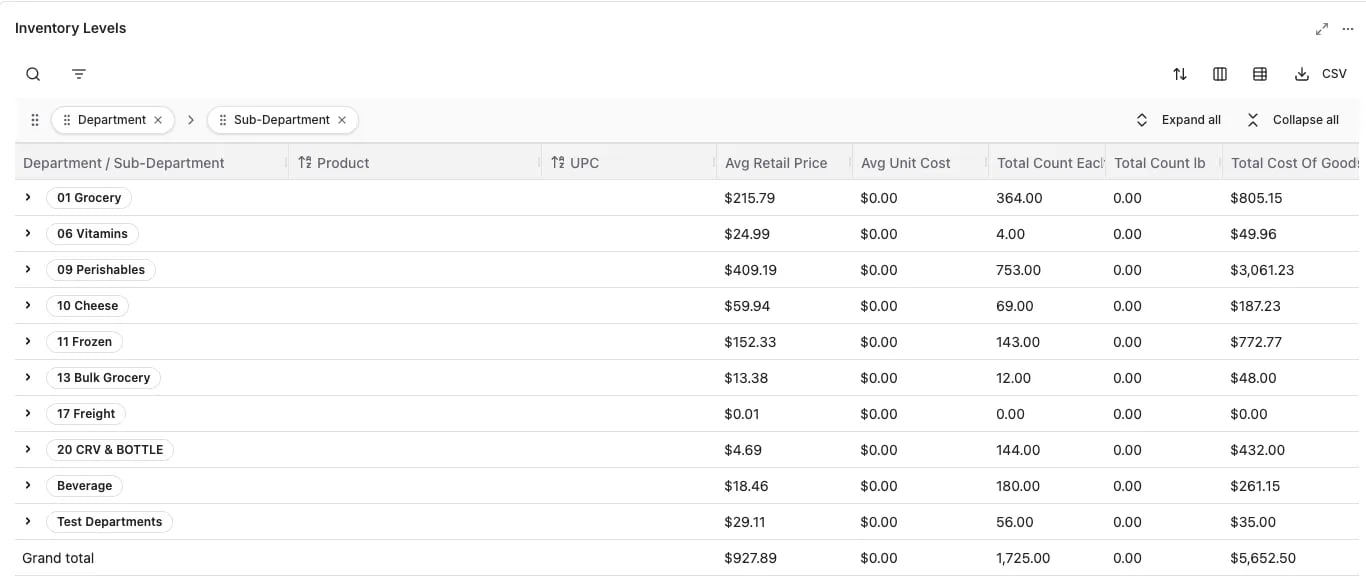
The Inventory Levels data table breaks down your Total Cost of Goods in Stock and Average Unit Cost, allowing you to see the financial value of your inventory by department.
Inventory History Report
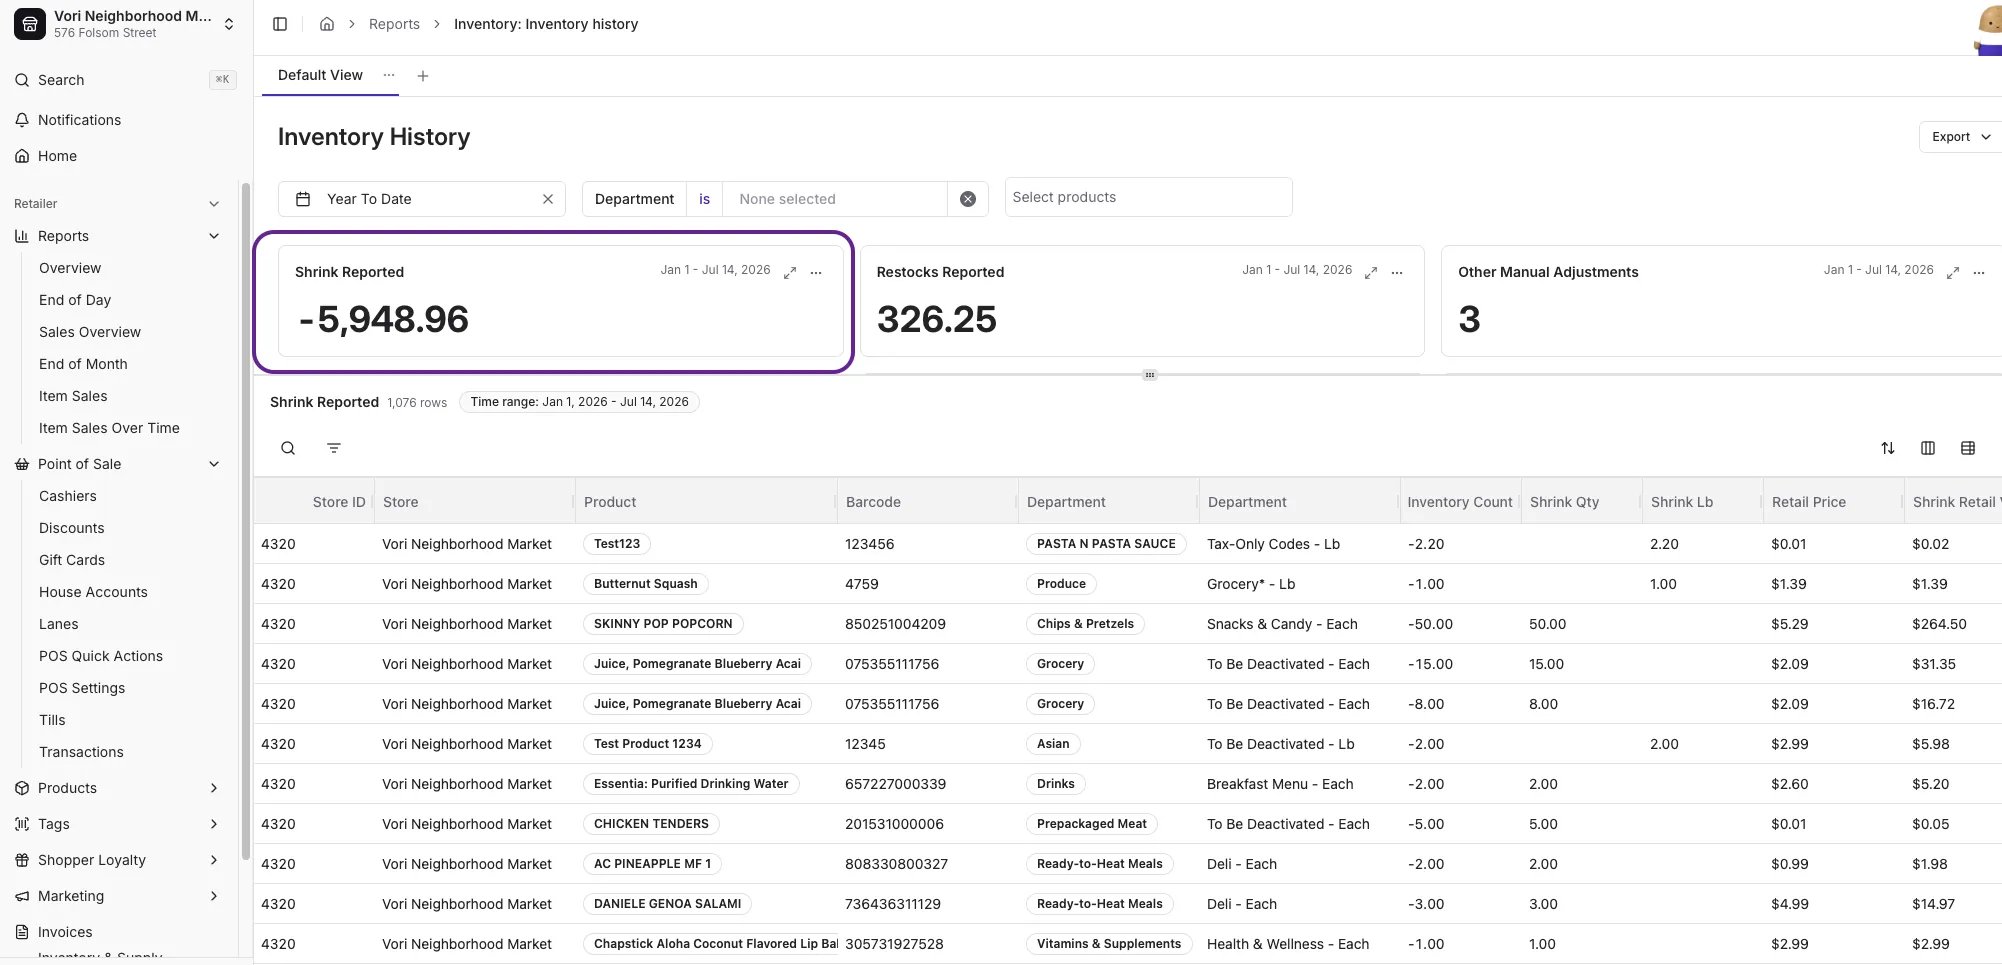
This report eliminates the guesswork by providing a timeline of every sale, restock, and user adjustment that touched your stock count.Where can I see a snapshot of items removed due to spoilage or theft?
-
The Underlying data lists total volume of items deducted from inventory that were categorized as shrinkage.
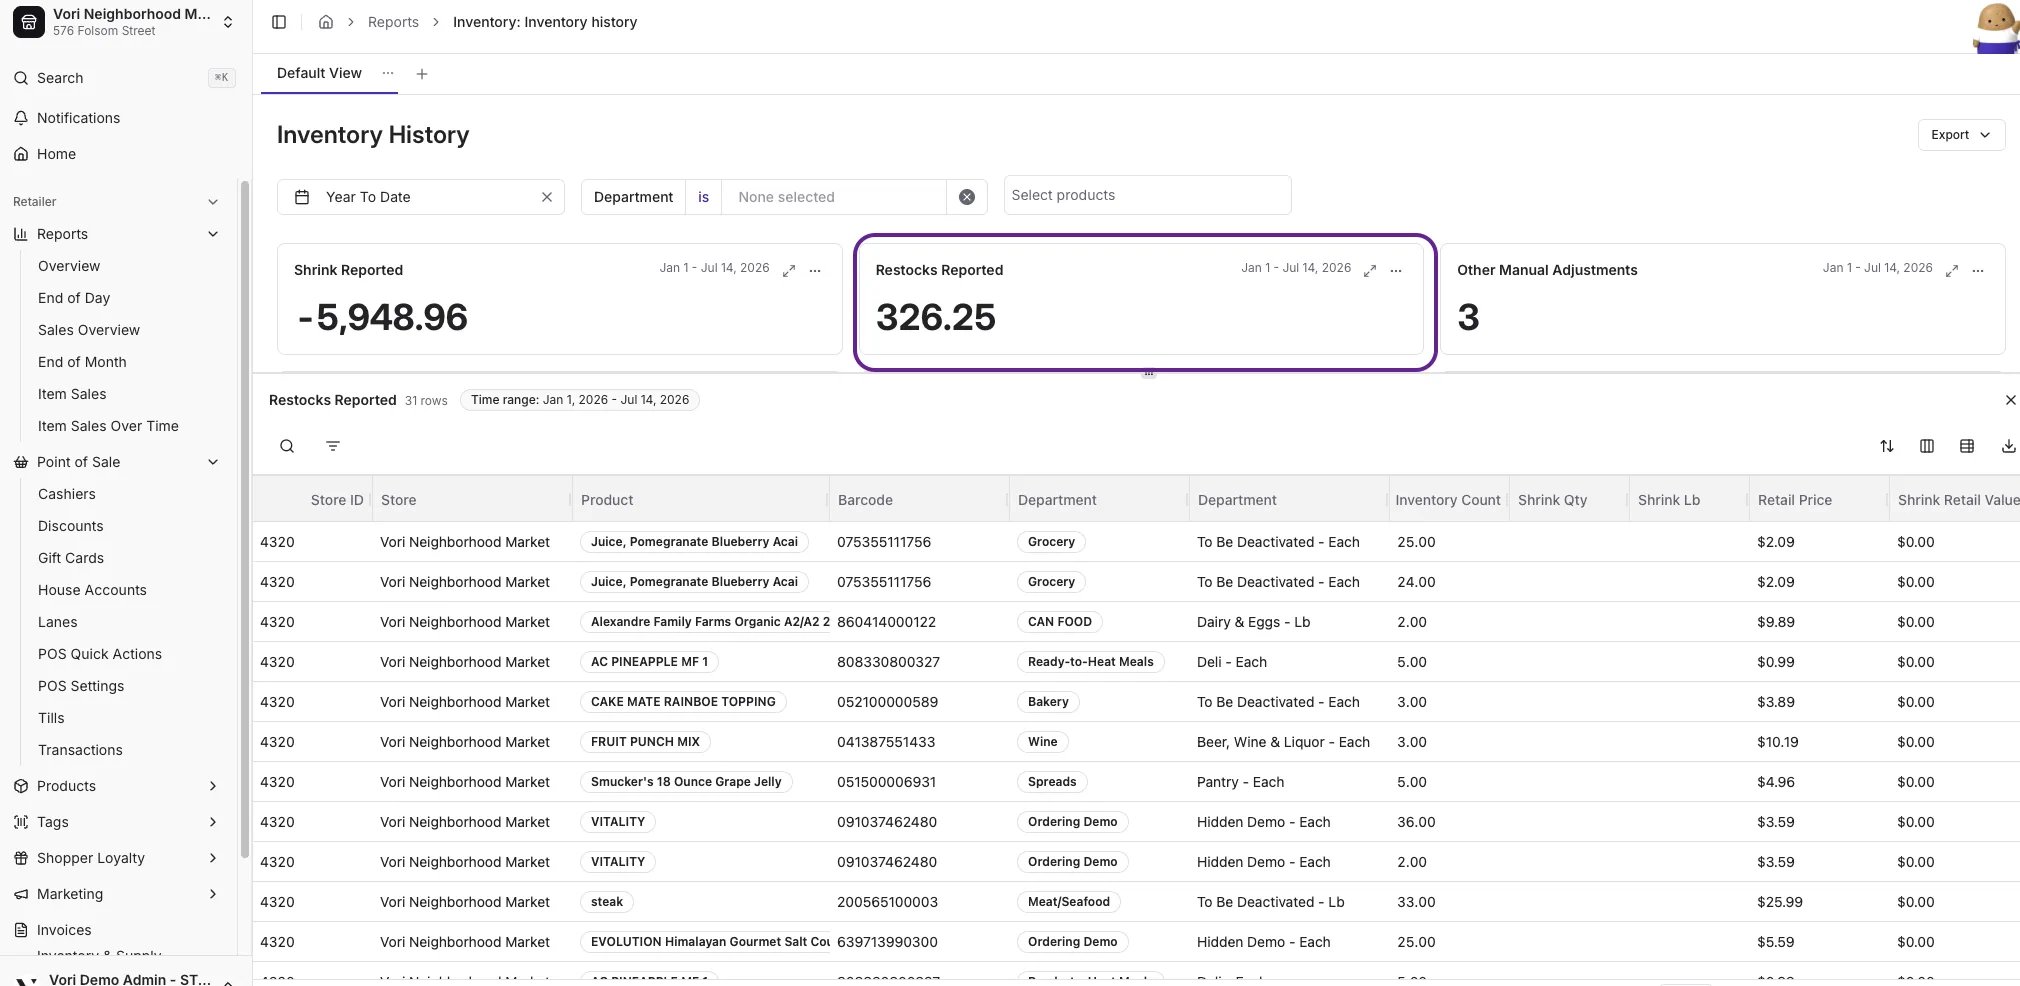
Where can I see a summary of manual restocks performed by staff?
-
The Restocks Reported table displays the quantity of items manually added back into inventory, such as restocking from back-of-house storage or receiving deliveries.
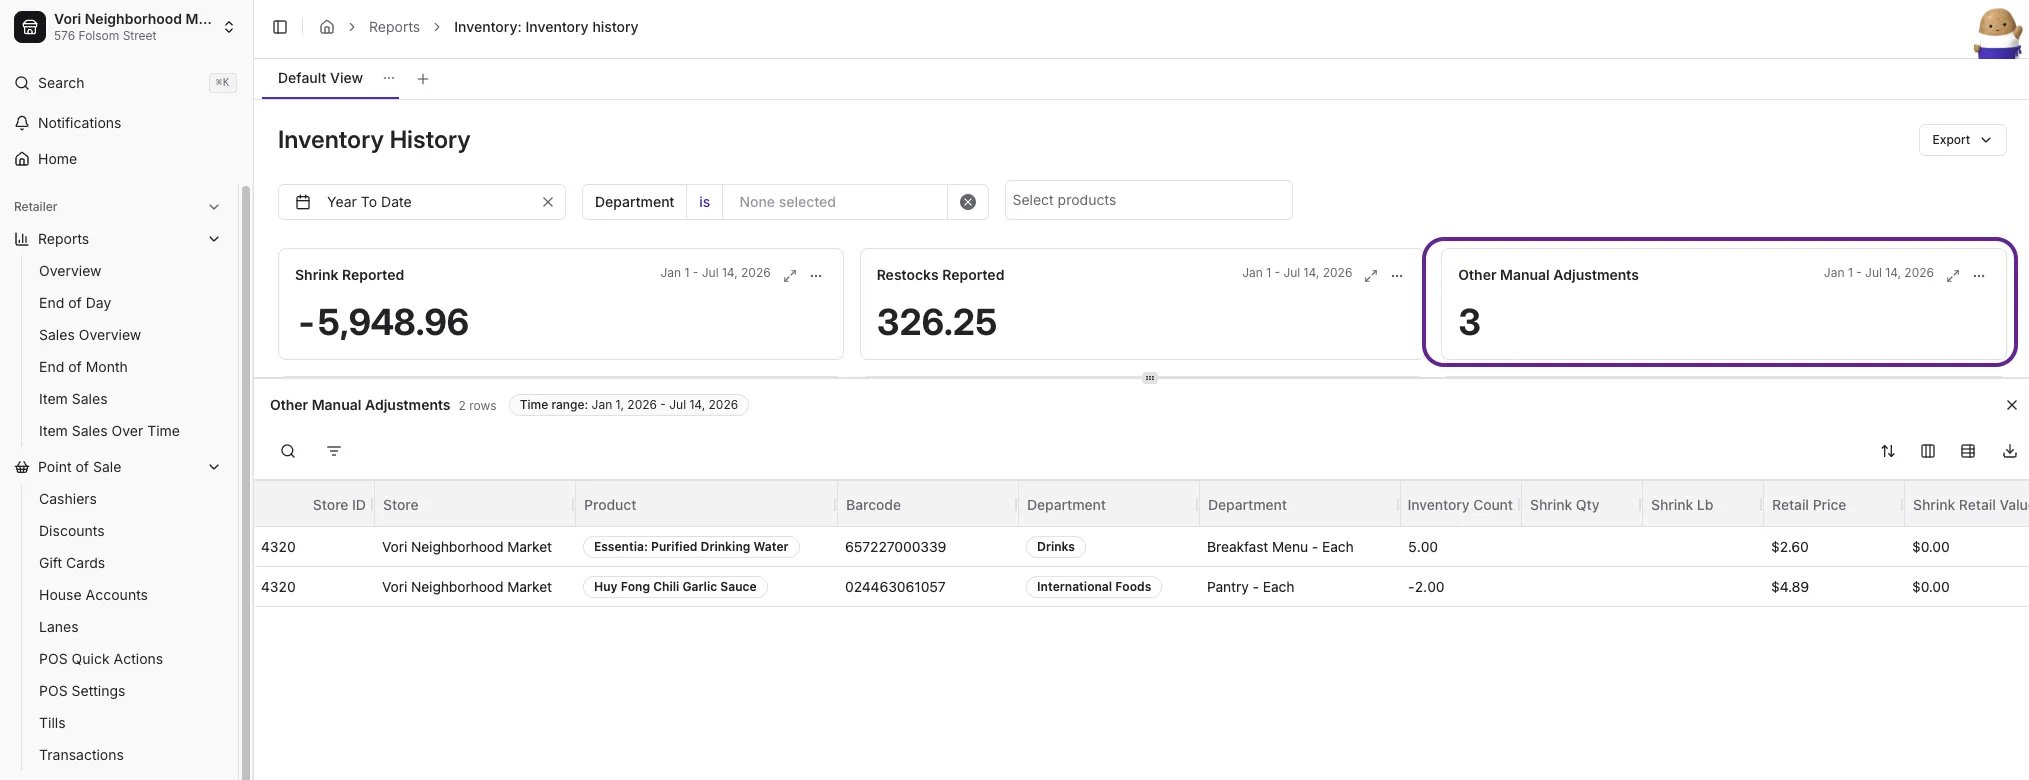
Where can I see other miscellaneous stock updates?
-
The Other Manual Adjustments graph tracks manual changes that do not fit into standard shrink or restock categories, such as corrections made during cycle counts.
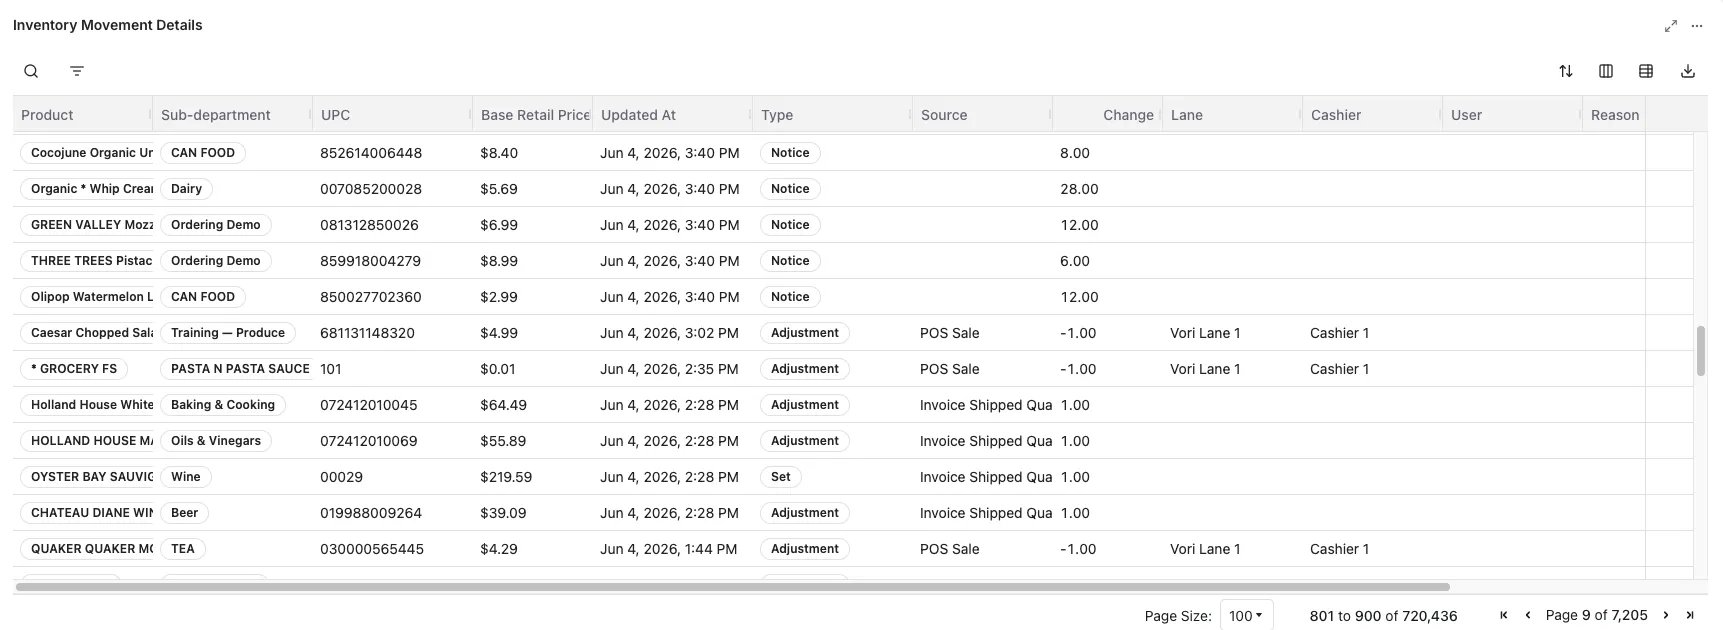
Where can I find a granular audit trail of every inventory change?
-
The Inventory Movements Details table provides a line-by-line log of every transaction. It lists the Entry Date, Count or Adjustment amount, Entry Type (e.g., Sale, Adjustment), Reason Code, User, and Source, so you can see exactly who changed a stock level and why.
Shrink Report
Shrink is the silent killer of margins. This report helps you pinpoint exactly where you are losing product to spoilage, damage, or theft. The Total Quantity metric displays a negative number representing the total volume of product lost. This aggregates items tracked by count, pound, or ounce.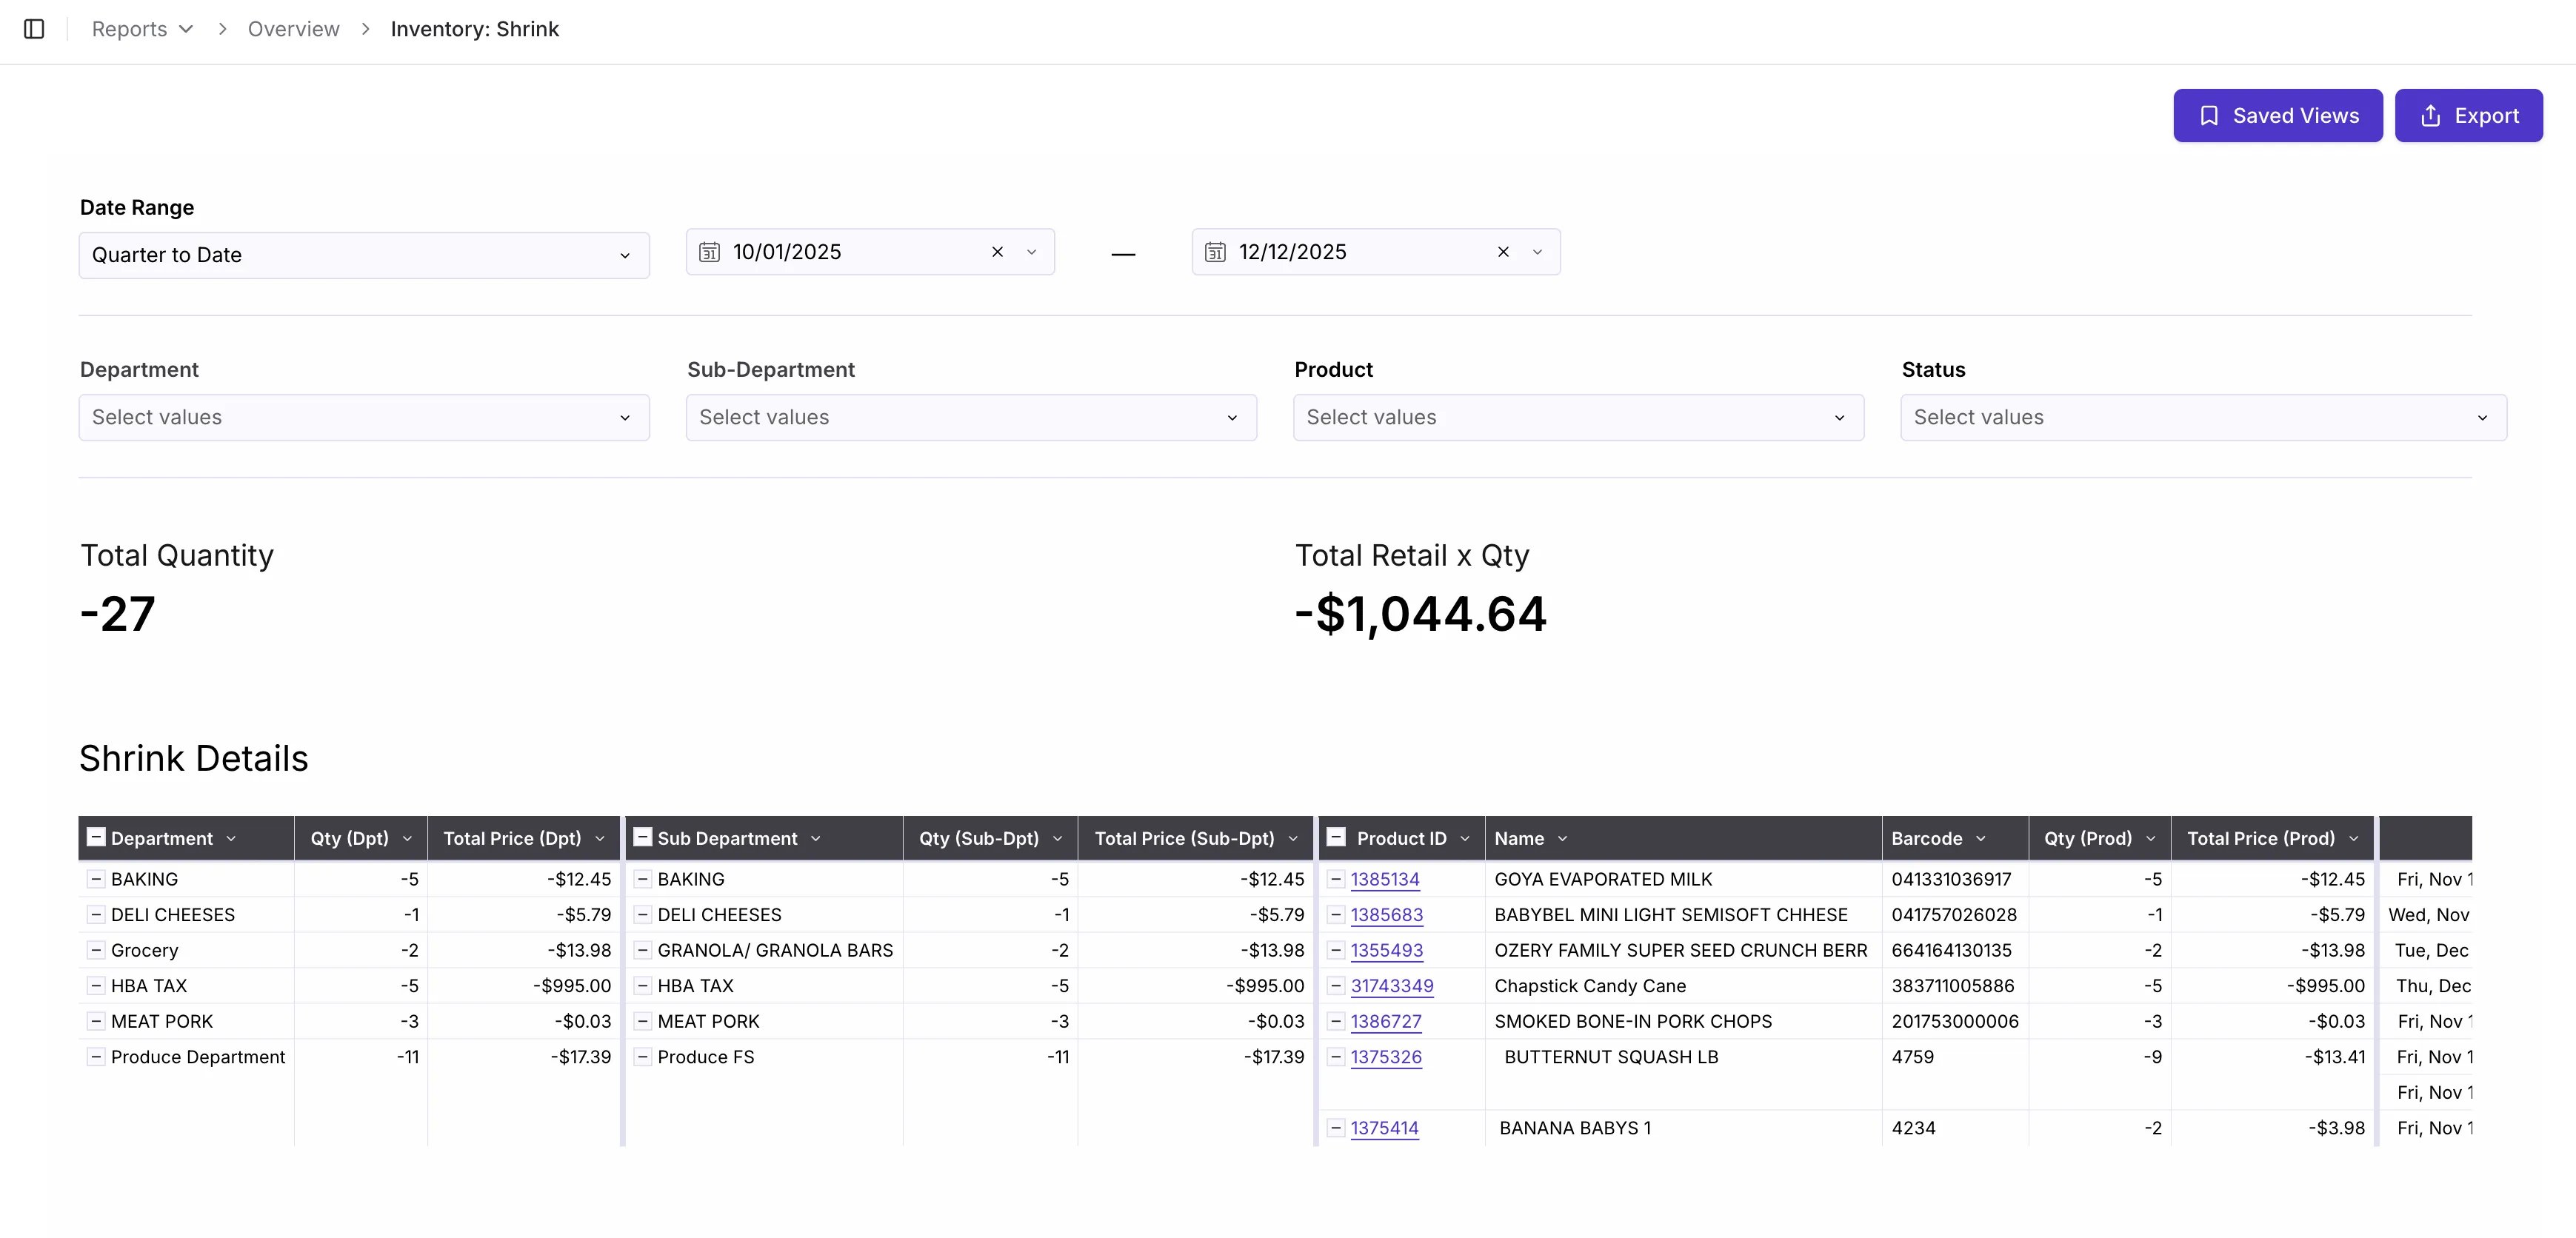
Where can I see the Reason Codes?
- To view the reason codes (e.g., Damage, Theft, Spoilage, Other), you must View Underlying Data.
Where can I see shrink broken down by department?
- Use the Department filter and sort the columns as needed.
Inventory Manual Counts
This report validates your team’s hard work by instantly summarizing the volume and value of every physical count completed.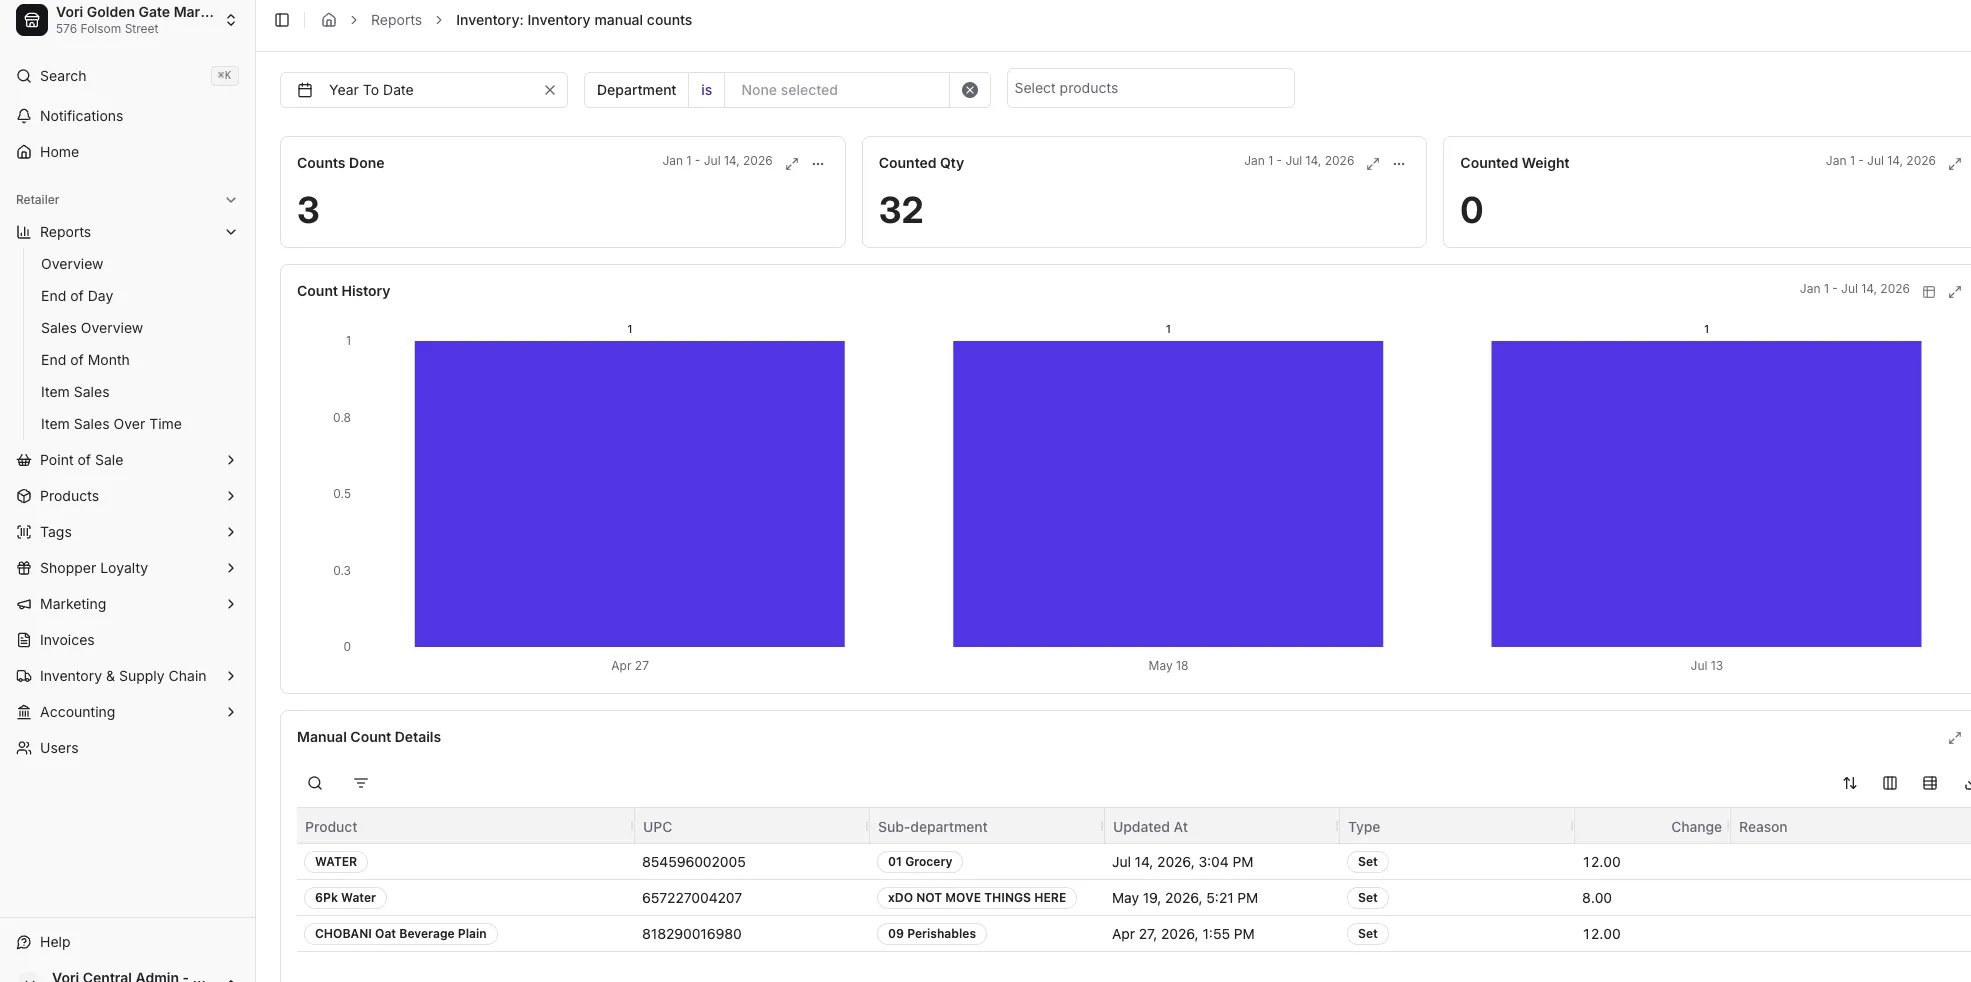
Where can I find a summary of the physical inventory counts recently completed by my team?
- The Counts Done metric provides a high-level total of how many distinct counting actions were performed within the date range.
Where can I see the total value of the items we just finished counting?
- The Count Totals column in the table shows the specific retail price and unit cost associated with the items counted, giving you a snapshot of the value of the inventory you just processed.
Where can I see a breakdown of items counted by weight versus by unit?
- The Counted Weight and Counted Quantity metrics provide aggregated totals for items tracked by weight (e.g., deli items) versus items tracked by unit (e.g., packaged goods).
Where can I see the last recorded count for a specific product?
- You can expand the table to see the Last Count details per product, including the specific Last Count Retail Price and Latest Unit Cost.