✏️ Note: The New Back Office (app.vori.com) experience is currently in beta testing and launching in select stores. This article describes features in the New Back Office. For instructions on accessing it, view our guide: Access the New Back Office.
Overview
If you operate more than one store location, you can use Central View in the Vori Back Office to review performance and reporting across your banner.
Central reporting gives you visibility into:
-
Combined sales totals and item movement.
-
California Redemption Value (CRV) totals.
-
Store-by-store comparisons.
-
Multi-store rollup reports and store-specific reports.
✏️ Note: You can view all available reports for each store in Central View. For large reports, use filter options and scrolling to see data across all stores.
Access Central Reporting
Follow these steps to switch to the Central View dashboard:
-
Log in to app.vori.com.
-
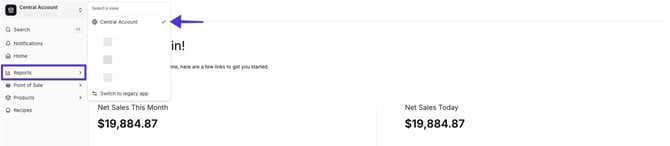
In the top-left corner, click the Banner Name dropdown (it will show the current store you are logged into).
-
Select Central Account.
-
From the left menu, select Reporting.
- You are now viewing the consolidated data for all your stores.
✏️ Note: You must have permission to access Central View. Contact Vori Support if you do not see the option.
Key Multi-Store Reports
Sales Overview
-
Provides a high-level summary of your total sales.
-
Displays combined sales totals for the banner.
-
Provides store-to-store comparisons on a visual graph.
-
Each store appears as a separate line for easy trend evaluation.
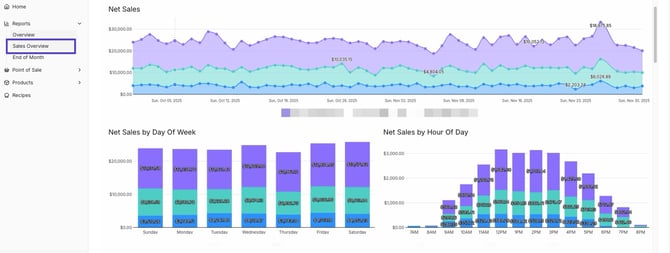
💡 Tip: Use the Sales Overview graph to identify seasonal trends, peak days, and store-specific opportunities.
End of Month
-
Provides a clear financial summary for accounting and operational review.
-
Includes rollup of monthly totals across all stores.
-
Displays CRV values, refunds, voids, and payment type summaries.
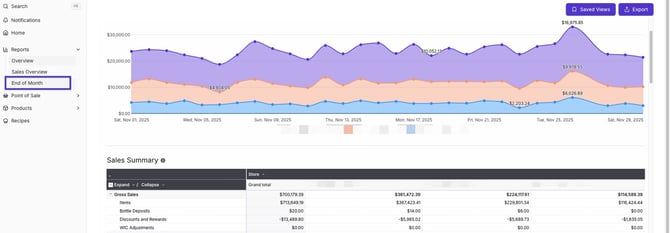
💡 Tip: This report is ideal for closing accounting periods and reviewing monthly performance.
Store-Level vs. Combined Data
Most reports offer both combined summary data and store-specific detail views.
Examples:
-
Item Sales Report: View all locations combined or filter by store.
-
Sales Overview: Displays each store individually on the graph.
✏️ Note: Some reports automatically calculate banner totals, while others provide separate pages per store. Use the filter options and scrolling in large reports to ensure you see all relevant data across each store.