> ## Documentation Index
> Fetch the complete documentation index at: https://help.vori.com/llms.txt
> Use this file to discover all available pages before exploring further.
# Generate a report of the top-selling items per department
> Use the Item Sales report to see top-selling items by department across a selected date range.
### Opening the Item Sales report
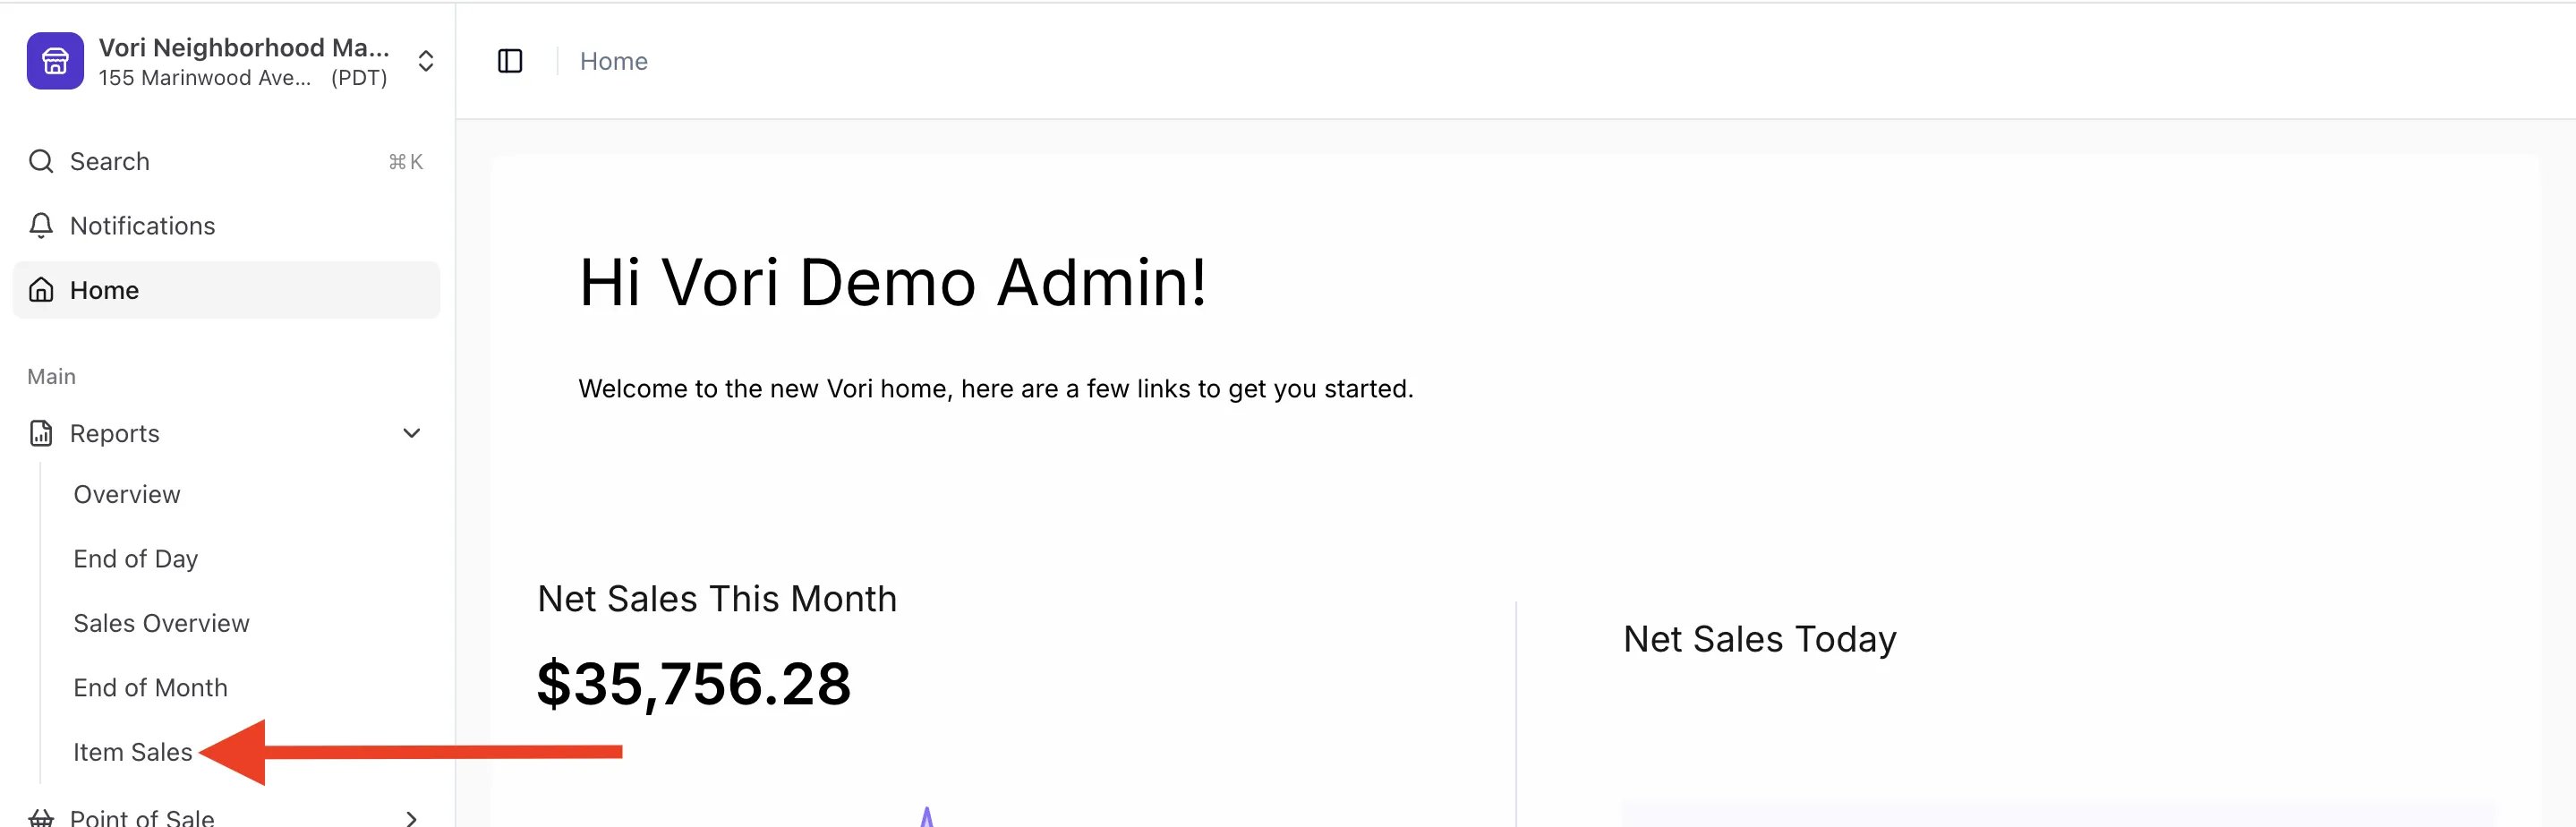
1. In Back Office, select **Reports** on the lefthand menu.
2. Within the Reports dropdown, select the **Item Sales** report.
 ### Setting a date range for the report
On the top left section of the Item Sales report, set the desired date range for the report.
### Setting a date range for the report
On the top left section of the Item Sales report, set the desired date range for the report.
 ### Setting groupings for the report
Directly above the Item Sales table at the bottom of the report, make sure the following settings are made:
* **Group:** Department
* \*\*Sub-Group:\*\*Sub-Department
✏️ **Note -** This will organize items by department, and then group related sub-departments under each one. The list will be sorted alphabeticallyby department, then by sub-department within each department.
### Setting groupings for the report
Directly above the Item Sales table at the bottom of the report, make sure the following settings are made:
* **Group:** Department
* \*\*Sub-Group:\*\*Sub-Department
✏️ **Note -** This will organize items by department, and then group related sub-departments under each one. The list will be sorted alphabeticallyby department, then by sub-department within each department.
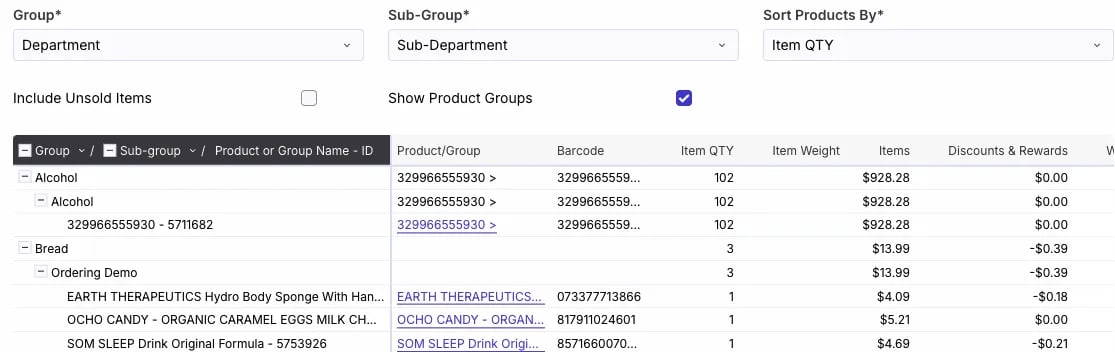 And select one of three options to determine how the products within the report are sorted
* **Sort Products By:**
1. Item QTY: Sort the products within each sub-department in descending order with the highest item quantity sold at the top.
2. Item Weight: Sort the products within each sub-department in descending order, placing the items with the highest total weight sold at the top.
3. Net Sales: Sort the products within each sub-department in descending order, with the items that generated the highest total sales revenue listed at the top.
✏️ \*\*Note -\*\*Products with no sales data for the given date range are automatically excluded from the Item Sales report. To include these items in the report, select the **Unsold Items Excluded** toggle by the report groupings.
And select one of three options to determine how the products within the report are sorted
* **Sort Products By:**
1. Item QTY: Sort the products within each sub-department in descending order with the highest item quantity sold at the top.
2. Item Weight: Sort the products within each sub-department in descending order, placing the items with the highest total weight sold at the top.
3. Net Sales: Sort the products within each sub-department in descending order, with the items that generated the highest total sales revenue listed at the top.
✏️ \*\*Note -\*\*Products with no sales data for the given date range are automatically excluded from the Item Sales report. To include these items in the report, select the **Unsold Items Excluded** toggle by the report groupings.
 ### Reviewing the report
After the report is generated and filtered, scroll to the **Item Sales** table at the bottom of the page.
* Click the **minus (-) sign** next to any **Sub-Department** name to collapse product rows into a single sales total for that sub-department.
### Reviewing the report
After the report is generated and filtered, scroll to the **Item Sales** table at the bottom of the page.
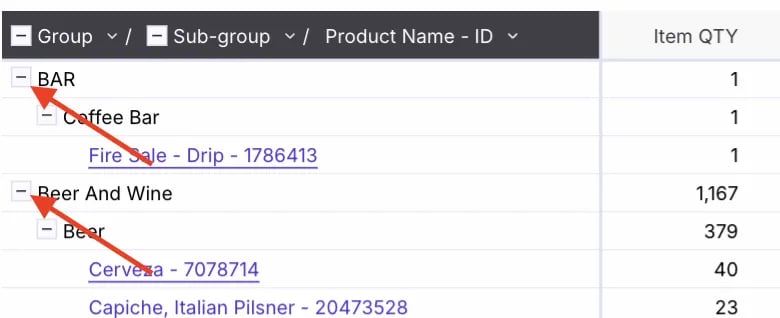
* Click the **minus (-) sign** next to any **Sub-Department** name to collapse product rows into a single sales total for that sub-department.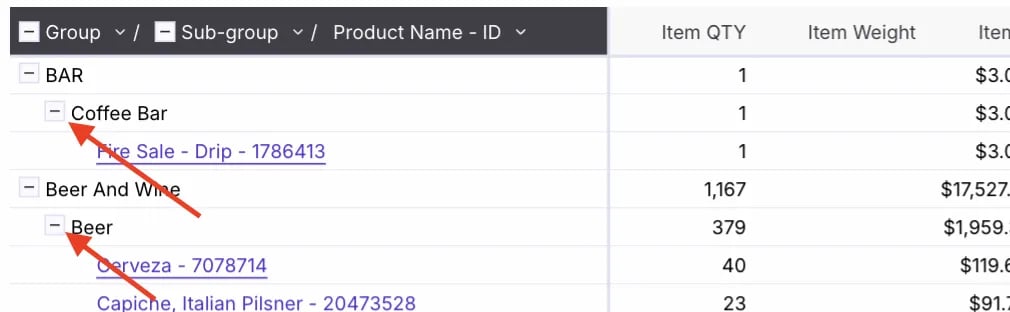 * The same can be done at the **Department** level to view totals without sub-department or item-level detail.
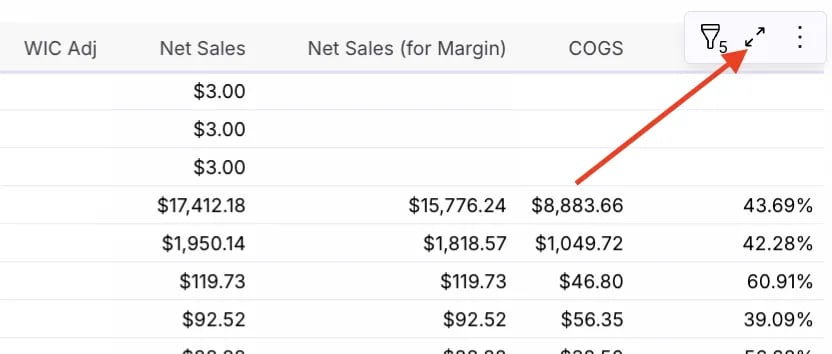
 * Hover over the **top-right corner** of the table and click the **expand icon** to enlarge the view and display all product details, including sales quantity, item weight, and net sales.
 ## Related topics
- [Frequently Asked Questions](/faqs.md)
- [Advanced Reporting: Filtering, Customizing, and Saving Report Views](/reporting/sales-and-product-performance/advanced-reporting-filtering-customizing-and-saving-report-views.md)
- [Review and Print the Till Report](/reporting/daily-and-shift-reports/review-and-print-the-till-report.md)
## Related topics
- [Frequently Asked Questions](/faqs.md)
- [Advanced Reporting: Filtering, Customizing, and Saving Report Views](/reporting/sales-and-product-performance/advanced-reporting-filtering-customizing-and-saving-report-views.md)
- [Review and Print the Till Report](/reporting/daily-and-shift-reports/review-and-print-the-till-report.md)