> ## Documentation Index
> Fetch the complete documentation index at: https://help.vori.com/llms.txt
> Use this file to discover all available pages before exploring further.
# How to review Campaigns reporting
> This article explains how to navigate and understand Campaigns reporting in Back Office
### Introduction
Understanding SMS [campaign](/customer-marketing/campaigns-and-coupons/automated-campaign-messages-and-coupons) reporting is crucial because it helps to track the effectiveness of the store's SMS marketing efforts, make data-driven decisions, and maximize return on investment (ROI). You can expect to see data for a campaign populate in this report by the following day.
***
### Navigating to Campaigns Reporting
1. In Back Office, select `Reports` on the lefthand menu.
2. Select `Overview` in the dropdown menu.
3. Within the Overviewpage, select the `Shoppers` reporting tab towards the bottom of the page.
4. Within the Shoppers tab, select `Campaigns`.
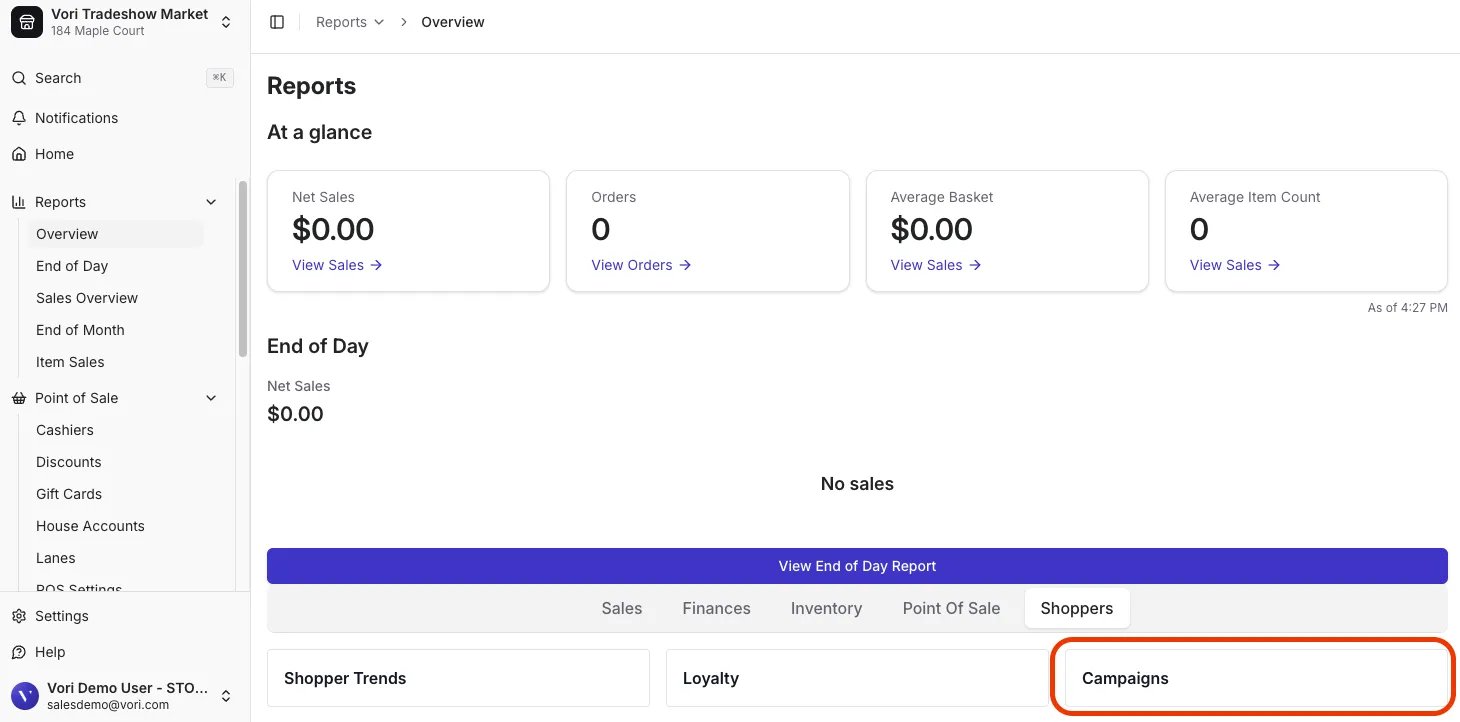 Within the Campaigns reporting page, there are four tabs that can be navigated around. The following sections will explain these four tabs.
***
### Overview tab
Select the preferred date ranges to see the number of coupons sent through **Come Back** and **Explore the Store** messages.
Within the Campaigns reporting page, there are four tabs that can be navigated around. The following sections will explain these four tabs.
***
### Overview tab
Select the preferred date ranges to see the number of coupons sent through **Come Back** and **Explore the Store** messages.
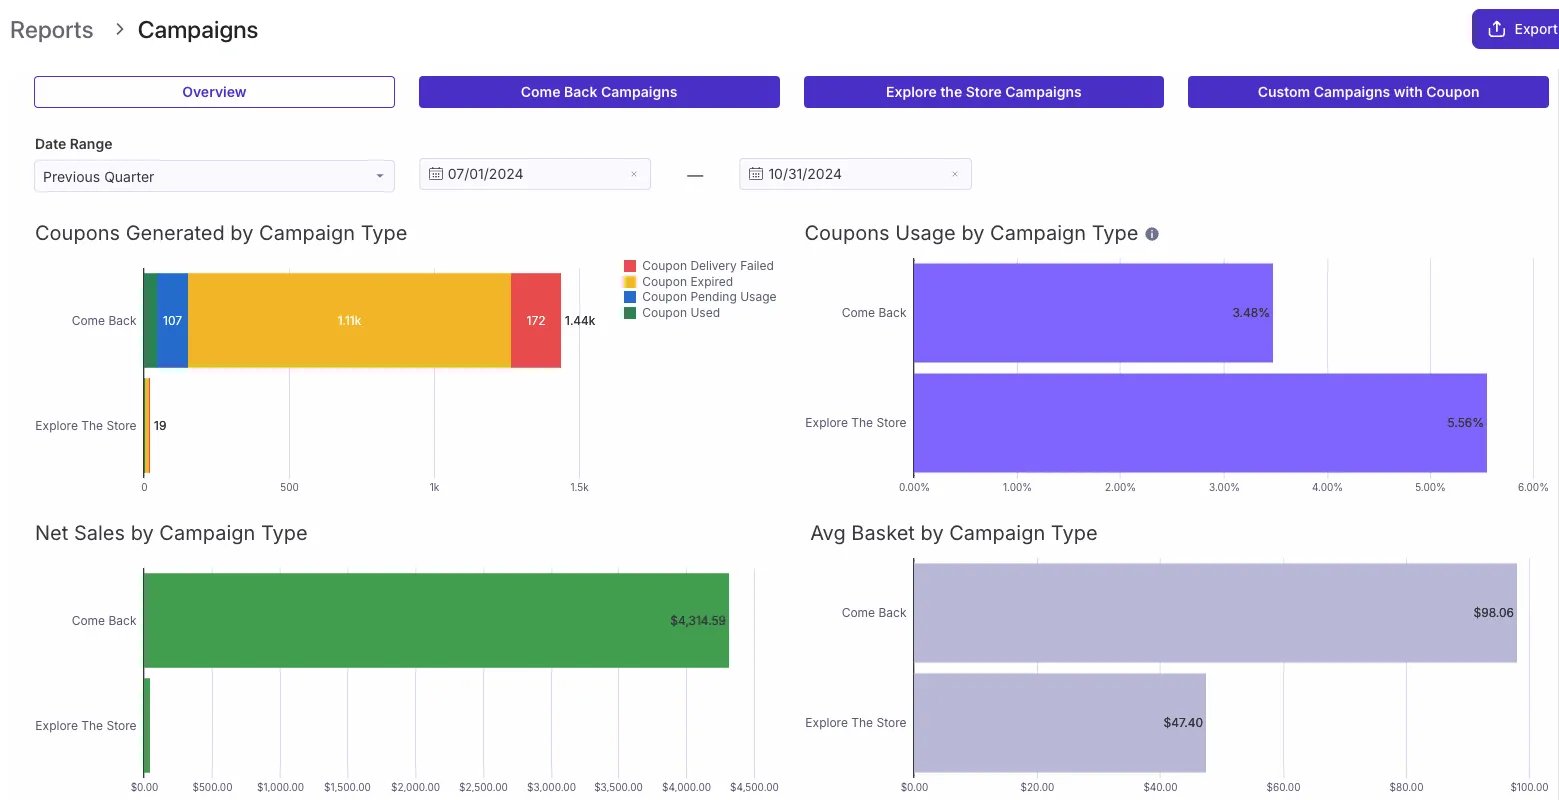 #### Coupons Generated by Campaign Type
This chart displays the number of failed coupon deliveries, expired coupons, pending coupons, and redeemed coupons.
#### Coupon Usage by Campaign Type
Shows the redemption rate as a percentage of coupons successfully sent out for each campaign.
#### Net Sales by Campaign Type
Total sales generated from orders that included coupon redemptions.
#### Avg Basket by Campaign Type
Average basket size for orders with coupon redemptions.
***
### Come Back Campaigns tab
#### Coupons Generated by Campaign Type
This chart displays the number of failed coupon deliveries, expired coupons, pending coupons, and redeemed coupons.
#### Coupon Usage by Campaign Type
Shows the redemption rate as a percentage of coupons successfully sent out for each campaign.
#### Net Sales by Campaign Type
Total sales generated from orders that included coupon redemptions.
#### Avg Basket by Campaign Type
Average basket size for orders with coupon redemptions.
***
### Come Back Campaigns tab
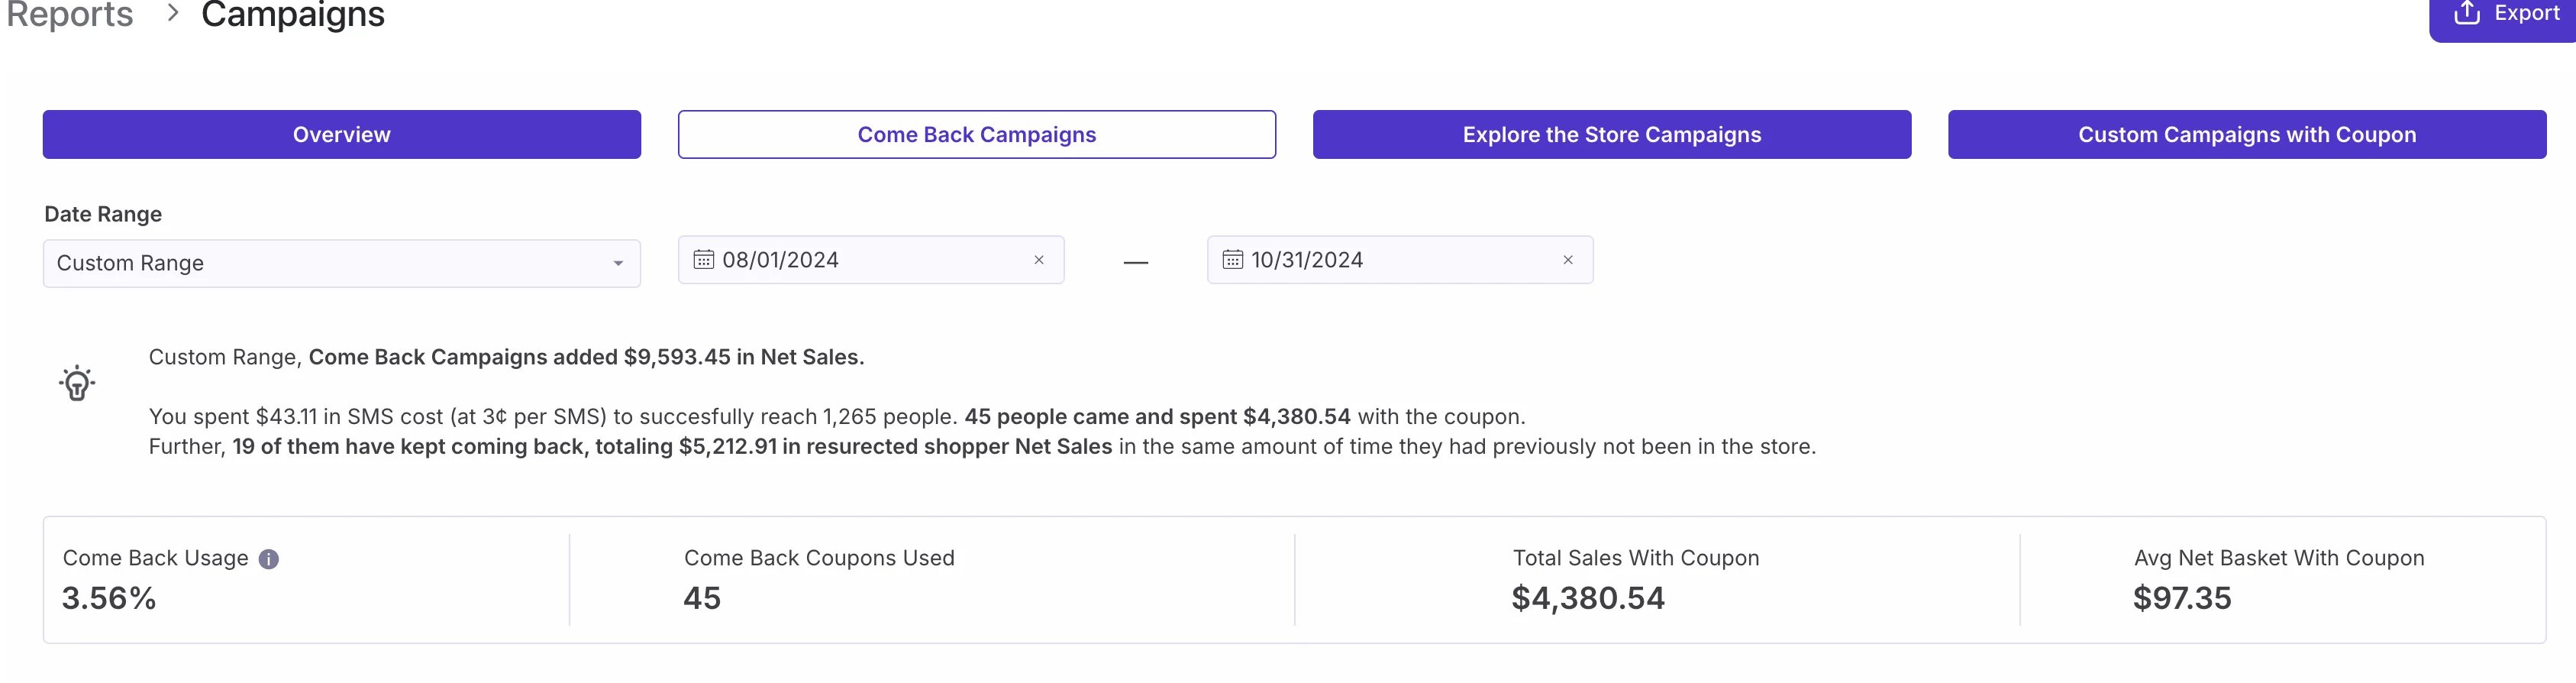 The 💡 section highlights the net sales contribution of the Come Back campaign during the selected date range.
Displays SMS costs and audience reach, detailing the number of customers who returned and made purchases using a coupon. Additionally, it shows how many customers engaged further, along with the total net sales attributed to these revived transactions.
The 💡 section highlights the net sales contribution of the Come Back campaign during the selected date range.
Displays SMS costs and audience reach, detailing the number of customers who returned and made purchases using a coupon. Additionally, it shows how many customers engaged further, along with the total net sales attributed to these revived transactions.
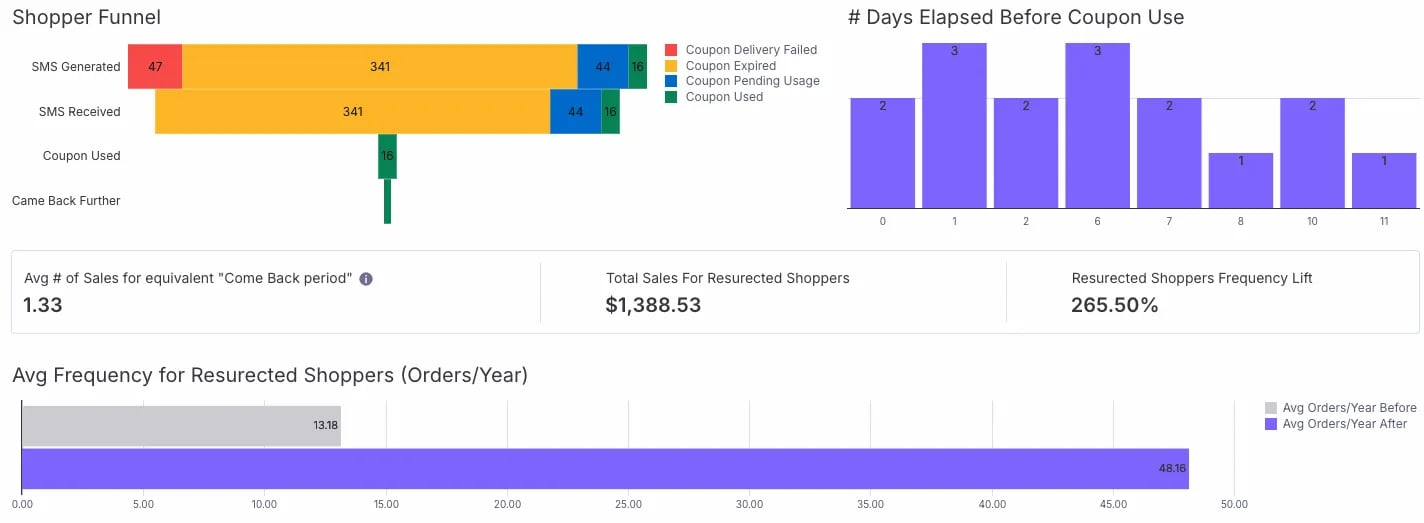 #### Shopper Funnel
Provides a visual overview of all coupons sent, detailing the quantities that have expired, been used, and are pending usage. It also includes the visit count for shoppers who "Came Back Further"
#### # of Days Elapsed Before Coupon Use
The chart displays the number of days that passed between the coupon being sent and its redemption. It may be beneficial to review this to determine the optimal duration for coupon validity.
#### Avg Frequency for Resurrected Shoppers (Orders/Year)
Shows the increased purchase frequency of resurrected shoppers, measured by the number of orders per year before and after coupon redemption. Reviewing the data in this chart can help identify if the campaign was successful in improving customer retention.
***
### Explore the Store Campaigns tab
#### Shopper Funnel
Provides a visual overview of all coupons sent, detailing the quantities that have expired, been used, and are pending usage. It also includes the visit count for shoppers who "Came Back Further"
#### # of Days Elapsed Before Coupon Use
The chart displays the number of days that passed between the coupon being sent and its redemption. It may be beneficial to review this to determine the optimal duration for coupon validity.
#### Avg Frequency for Resurrected Shoppers (Orders/Year)
Shows the increased purchase frequency of resurrected shoppers, measured by the number of orders per year before and after coupon redemption. Reviewing the data in this chart can help identify if the campaign was successful in improving customer retention.
***
### Explore the Store Campaigns tab
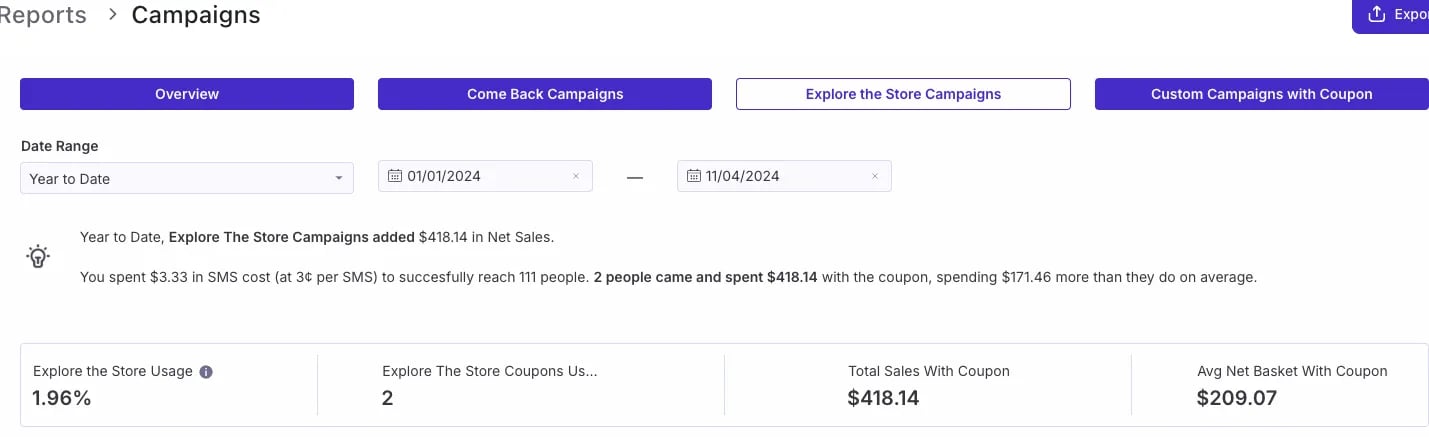 The 💡 section highlights the net sales contribution of the Explore the Store campaign during the selected date range.
Displays SMS costs and audience reach, detailing the number of customers who made purchases using a coupon. Additionally, it indicates how much more the shopper spent in comparison to their average spending.
The 💡 section highlights the net sales contribution of the Explore the Store campaign during the selected date range.
Displays SMS costs and audience reach, detailing the number of customers who made purchases using a coupon. Additionally, it indicates how much more the shopper spent in comparison to their average spending.
 #### Shopper Funnel
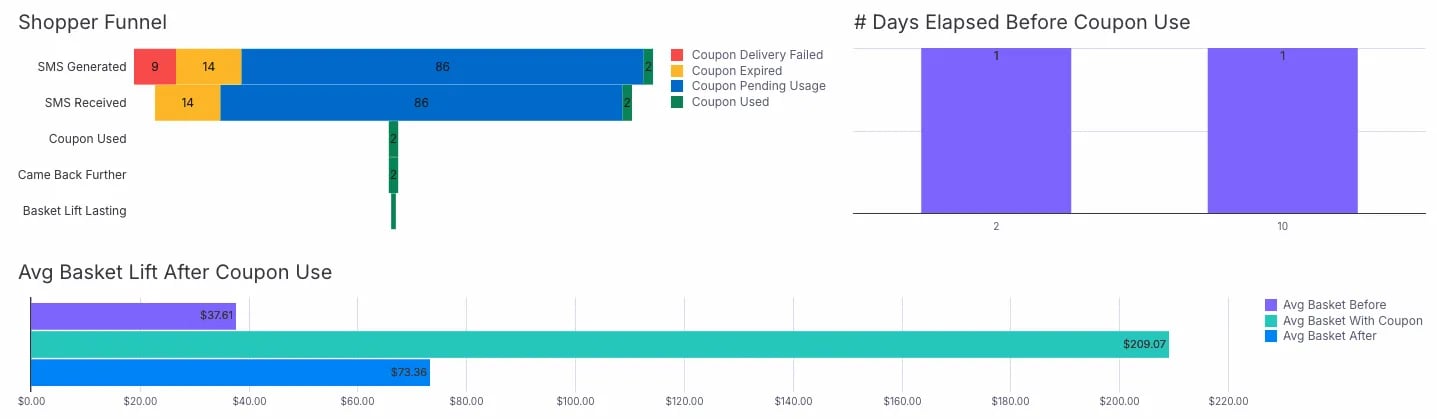
Provides a visual overview of all coupons sent, detailing the quantities that have expired, been used, and are pending usage. Also includes the visit count for shoppers who "Came Back Further" and the impact on Basket lift.
#### # of Days Elapsed Before Coupon Use
This chart displays the number of days that passed between the coupon being sent and its redemption. It may be beneficial to review this to determine the optimal duration for coupon validity.
#### Avg Basket Lift After Coupon Use
Compares a shopper's average basket size before coupon use, at the time of coupon redemption, and after their return. Reviewing this data helps retailers identify changes in shopper behavior and the impact on basket sizes.
***
### Custom Campaigns with Coupon tab
#### Shopper Funnel
Provides a visual overview of all coupons sent, detailing the quantities that have expired, been used, and are pending usage. Also includes the visit count for shoppers who "Came Back Further" and the impact on Basket lift.
#### # of Days Elapsed Before Coupon Use
This chart displays the number of days that passed between the coupon being sent and its redemption. It may be beneficial to review this to determine the optimal duration for coupon validity.
#### Avg Basket Lift After Coupon Use
Compares a shopper's average basket size before coupon use, at the time of coupon redemption, and after their return. Reviewing this data helps retailers identify changes in shopper behavior and the impact on basket sizes.
***
### Custom Campaigns with Coupon tab
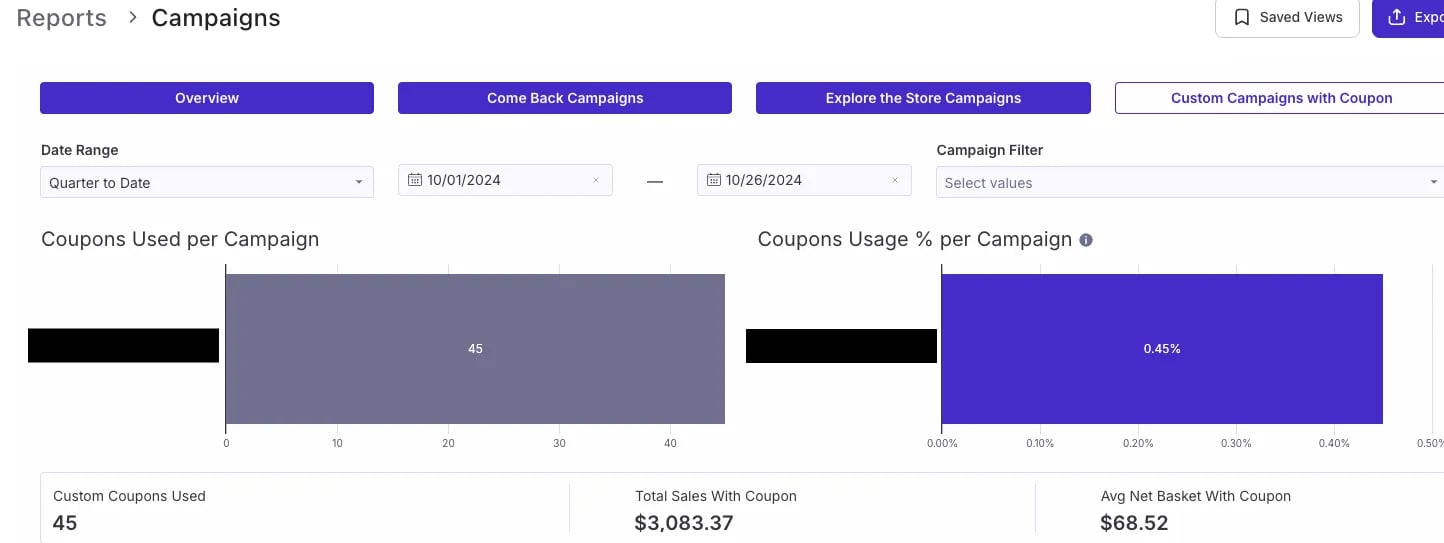 The data of this tab can be filtered by date range and campaign to refine the results.
These charts display the total number of coupons used per campaign, represented in both absolute numbers and percentages. Additionally, you can view the total sales generated from coupons, as well as the average basket size for these transactions.
The data of this tab can be filtered by date range and campaign to refine the results.
These charts display the total number of coupons used per campaign, represented in both absolute numbers and percentages. Additionally, you can view the total sales generated from coupons, as well as the average basket size for these transactions.
 #### Shopper Funnel
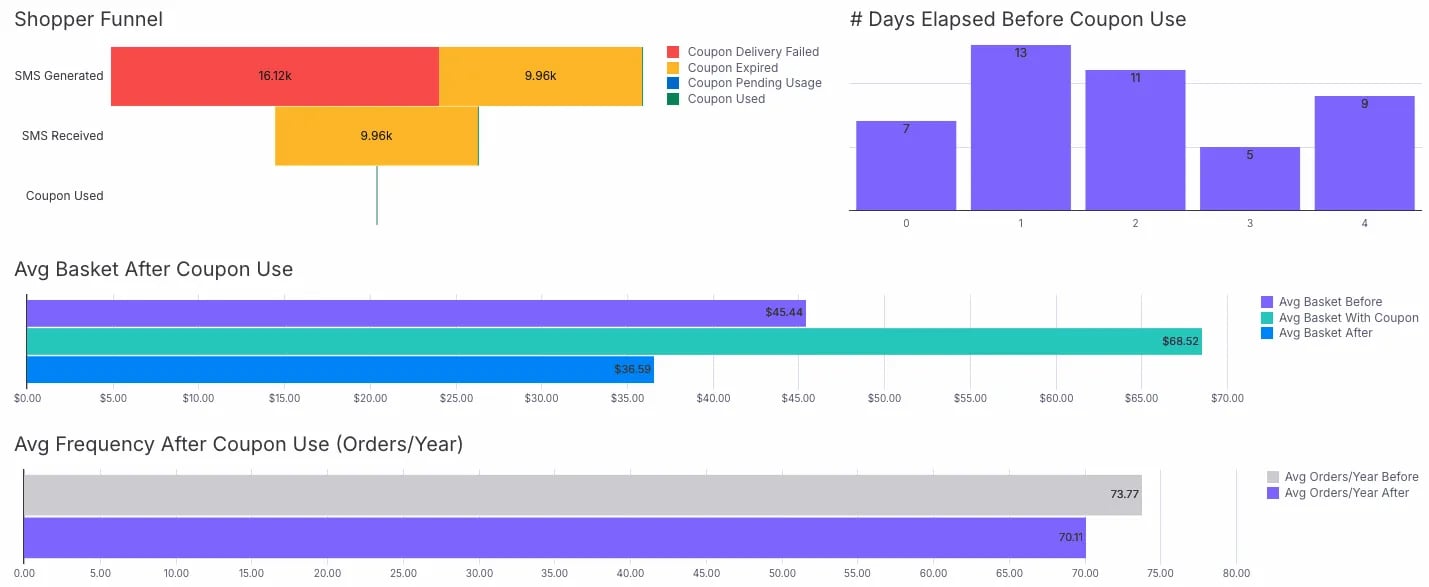
Provides a visual overview of all coupons sent, detailing the quantities that have expired, been used, and are pending usage.
#### # of Days Elapsed Before Coupon Use
The chart displays the number of days that passed between the coupon being sent and its redemption. It may be beneficial to review this to determine the optimal duration for coupon validity.
#### Avg Basket After Coupon Use
Compares a shopper's average basket size before coupon use, at the time of coupon redemption, and after their return. Reviewing this data helps retailers identify changes in shopper behavior and the impact on basket sizes.
#### Avg Frequency After Coupon Use (Orders/Yr)
Shows the increased purchase frequency of shoppers, measured by the number of orders per year before and after coupon redemption. Reviewing the data in this chart can help identify if the campaign was successful in improving customer retention.
***
### Additional notes
*
#### Shopper Funnel
Provides a visual overview of all coupons sent, detailing the quantities that have expired, been used, and are pending usage.
#### # of Days Elapsed Before Coupon Use
The chart displays the number of days that passed between the coupon being sent and its redemption. It may be beneficial to review this to determine the optimal duration for coupon validity.
#### Avg Basket After Coupon Use
Compares a shopper's average basket size before coupon use, at the time of coupon redemption, and after their return. Reviewing this data helps retailers identify changes in shopper behavior and the impact on basket sizes.
#### Avg Frequency After Coupon Use (Orders/Yr)
Shows the increased purchase frequency of shoppers, measured by the number of orders per year before and after coupon redemption. Reviewing the data in this chart can help identify if the campaign was successful in improving customer retention.
***
### Additional notes
*  If you want more detailed insights on a report, click the three dots (**⋯**) in the top-right corner of a figure or chart to reveal **More actions**, then select **View underlying data** for a line-by-line view. **Download as CSV** in the same menu exports the figure's data.
* View related orders where coupons were redeemed under the **Order ID** column, and select an **Order ID** to open the order.
* Reports can be exported via PDF and [scheduled for export](/reporting/tax-and-financial-reports/how-to-schedule-a-report-export).\
## Related topics
- [Reconcile Paysafe Deposits with your Sales Reports](/payments-and-financials/paysafe/reconcile-paysafe-deposits-with-your-sales-reports.md)
- [Reporting Category: Shoppers](/reporting/reporting-category-shoppers.md)
- [Automated Campaign Messages & Coupons](/customer-marketing/campaigns-and-coupons/automated-campaign-messages-and-coupons.md)
If you want more detailed insights on a report, click the three dots (**⋯**) in the top-right corner of a figure or chart to reveal **More actions**, then select **View underlying data** for a line-by-line view. **Download as CSV** in the same menu exports the figure's data.
* View related orders where coupons were redeemed under the **Order ID** column, and select an **Order ID** to open the order.
* Reports can be exported via PDF and [scheduled for export](/reporting/tax-and-financial-reports/how-to-schedule-a-report-export).\
## Related topics
- [Reconcile Paysafe Deposits with your Sales Reports](/payments-and-financials/paysafe/reconcile-paysafe-deposits-with-your-sales-reports.md)
- [Reporting Category: Shoppers](/reporting/reporting-category-shoppers.md)
- [Automated Campaign Messages & Coupons](/customer-marketing/campaigns-and-coupons/automated-campaign-messages-and-coupons.md)