Introduction
The Reporting page in Vori provides a centralized hub for exploring store performance and operational insights. With tools for data analysis, viewing transactions, tracking trends, and exporting reports, stores can make informed decisions backed by real-time data.
Main Home Page
The main homepage offers a concise overview of frequently accessed pages. Each chart includes a shortcut that directs users to its corresponding detailed report.

Overview page
To open the Overview page of reporting, select Reports.
Navigate to the Reports page from the left-hand navigation panel.

The top of the Overview displays a summary of Net Sales for the day, Total Orders, Average Basket Size, and Average Item Count per Basket. Click View within each section to open a detailed report.

Below these section is comparison of today’s net sales with the same day last week is also included. 
At the bottom of the Overview page, there are links to the End of Day Report, along with categorized sections for various automated reports. Detailed explanations of these reports are available in the following section.

End of Day Report
Follow along with this article here for a walk-through of our new End of Day report.
Reporting Categories
The remaining reports are grouped into five categories: Sales, Finance, Inventory, Point of Sale, and Shoppers.
Sales
Sales reports are vital for driving business strategy and optimizing operations. These reports allow for easy tracking of sales performance over time, identifying trends, and understanding customer behavior.
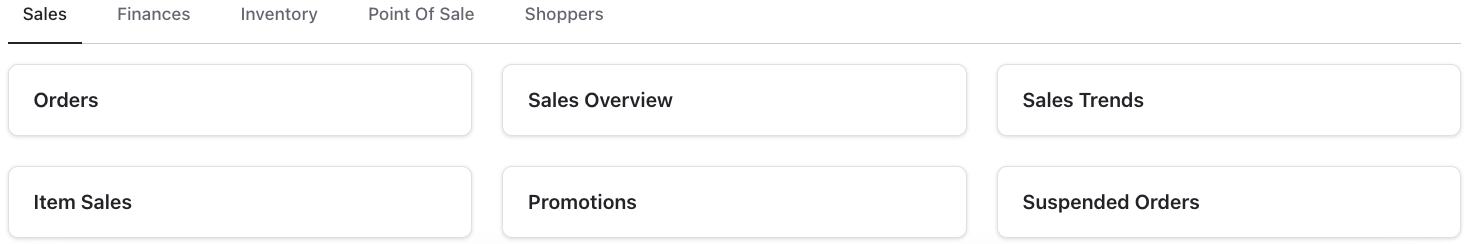
Orders
All Orders processed through the POS will be found here. Follow along with this article here to learn how to search/filter orders.
Sales Overview
This report presents a breakdown of Net Sales, Basket Size, Tips, Cashback, Payment Expected, and Orders for the selected date range. The accompanying charts deliver a visual overview of these metrics, segmented by days of the week and hours of the day. Additionally, the report also features data for the Top 10/20 and Bottom 10/20 Departments.
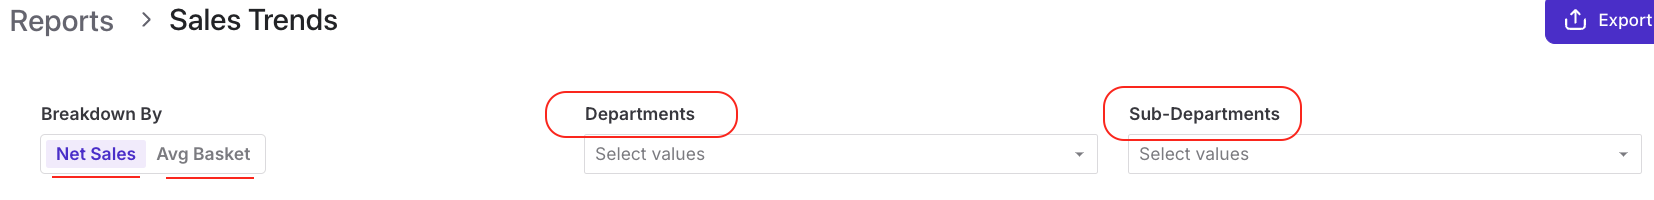
Sales Trends
Compare date data across previous days, weeks, and months.
Filter by Department/Sub-Department and toggle between Net Sales and Basket Size.
Item Sales
This report provides an overview of product sales and offers a detailed analysis to track specific trends and movements. It will show net sales, margins, and items that were sold in this period with an active cost. There are a variety of filters to choose from and can sort by various categories to gain deeper insights.
✏️ Note - Net Margin is calculated exclusively for items with valid costs.
Promotions
Visualizes promotion performance with comparisons of sales and basket sizes with and without promotions.
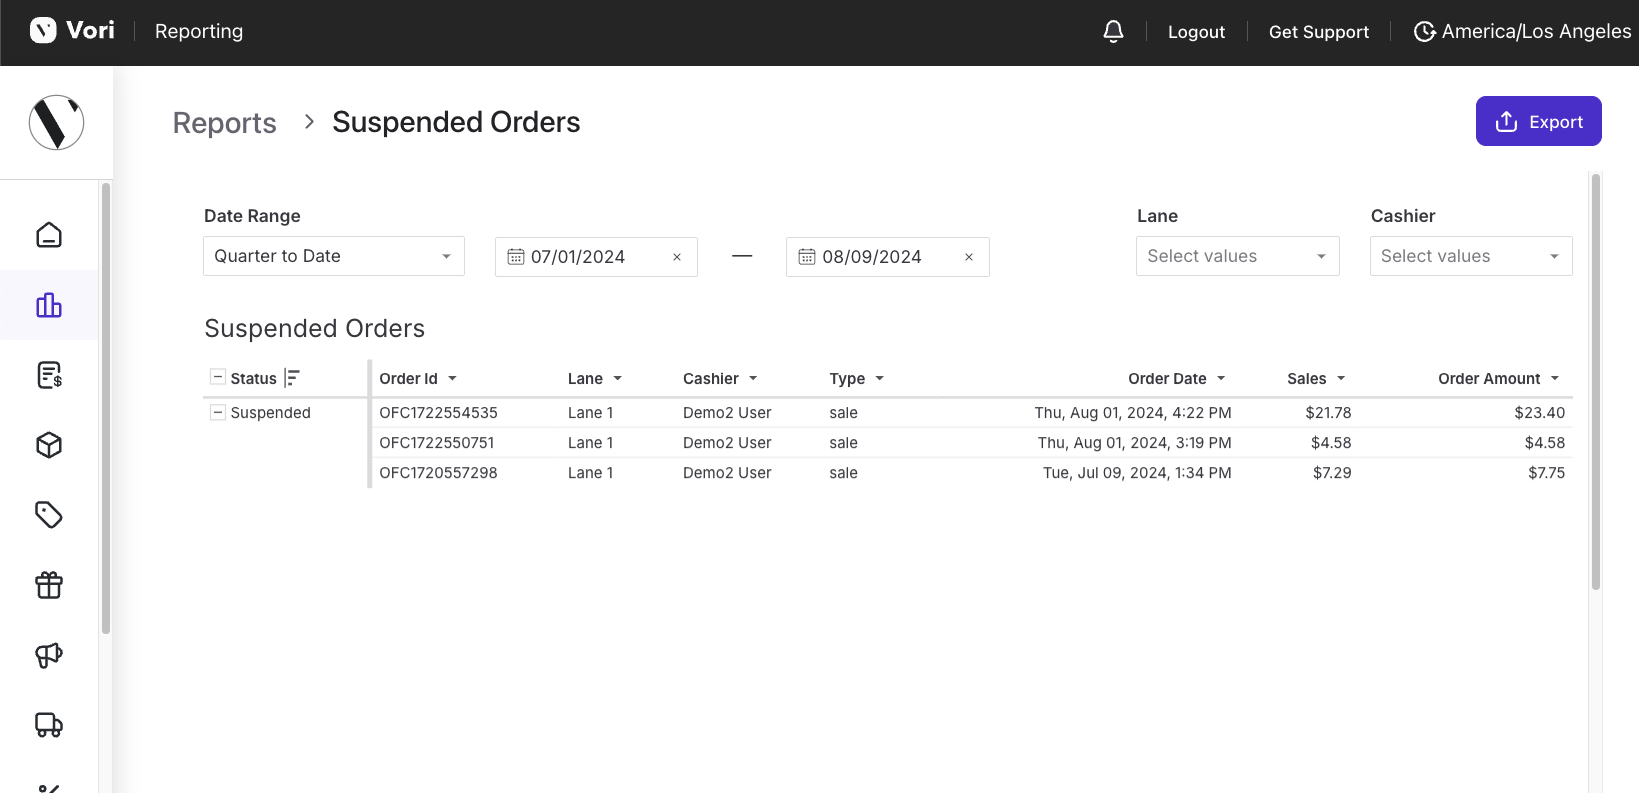
Suspended Orders
Displays all paused/suspended orders with filters for date range, lane, and cashier. Export available.
Department Sales
This report provides a breakdown of total (parent) Department sales and Sub-Department sales. Filter by different date ranges and highlight a single department is an available option.
End of Month
This report summarizes the End of Month sales (broken down by departments) and the total payments collected.
Finances

Payments
This report provides a comprehensive overview of all payment data. It details payment methods, total payments collected, and payments categorized by lane.
Taxes
Tax reports are essential for ensuring compliance and accurate financial management.
Tax reports summarizes tax collection by date, useful for financial reporting and compliance.
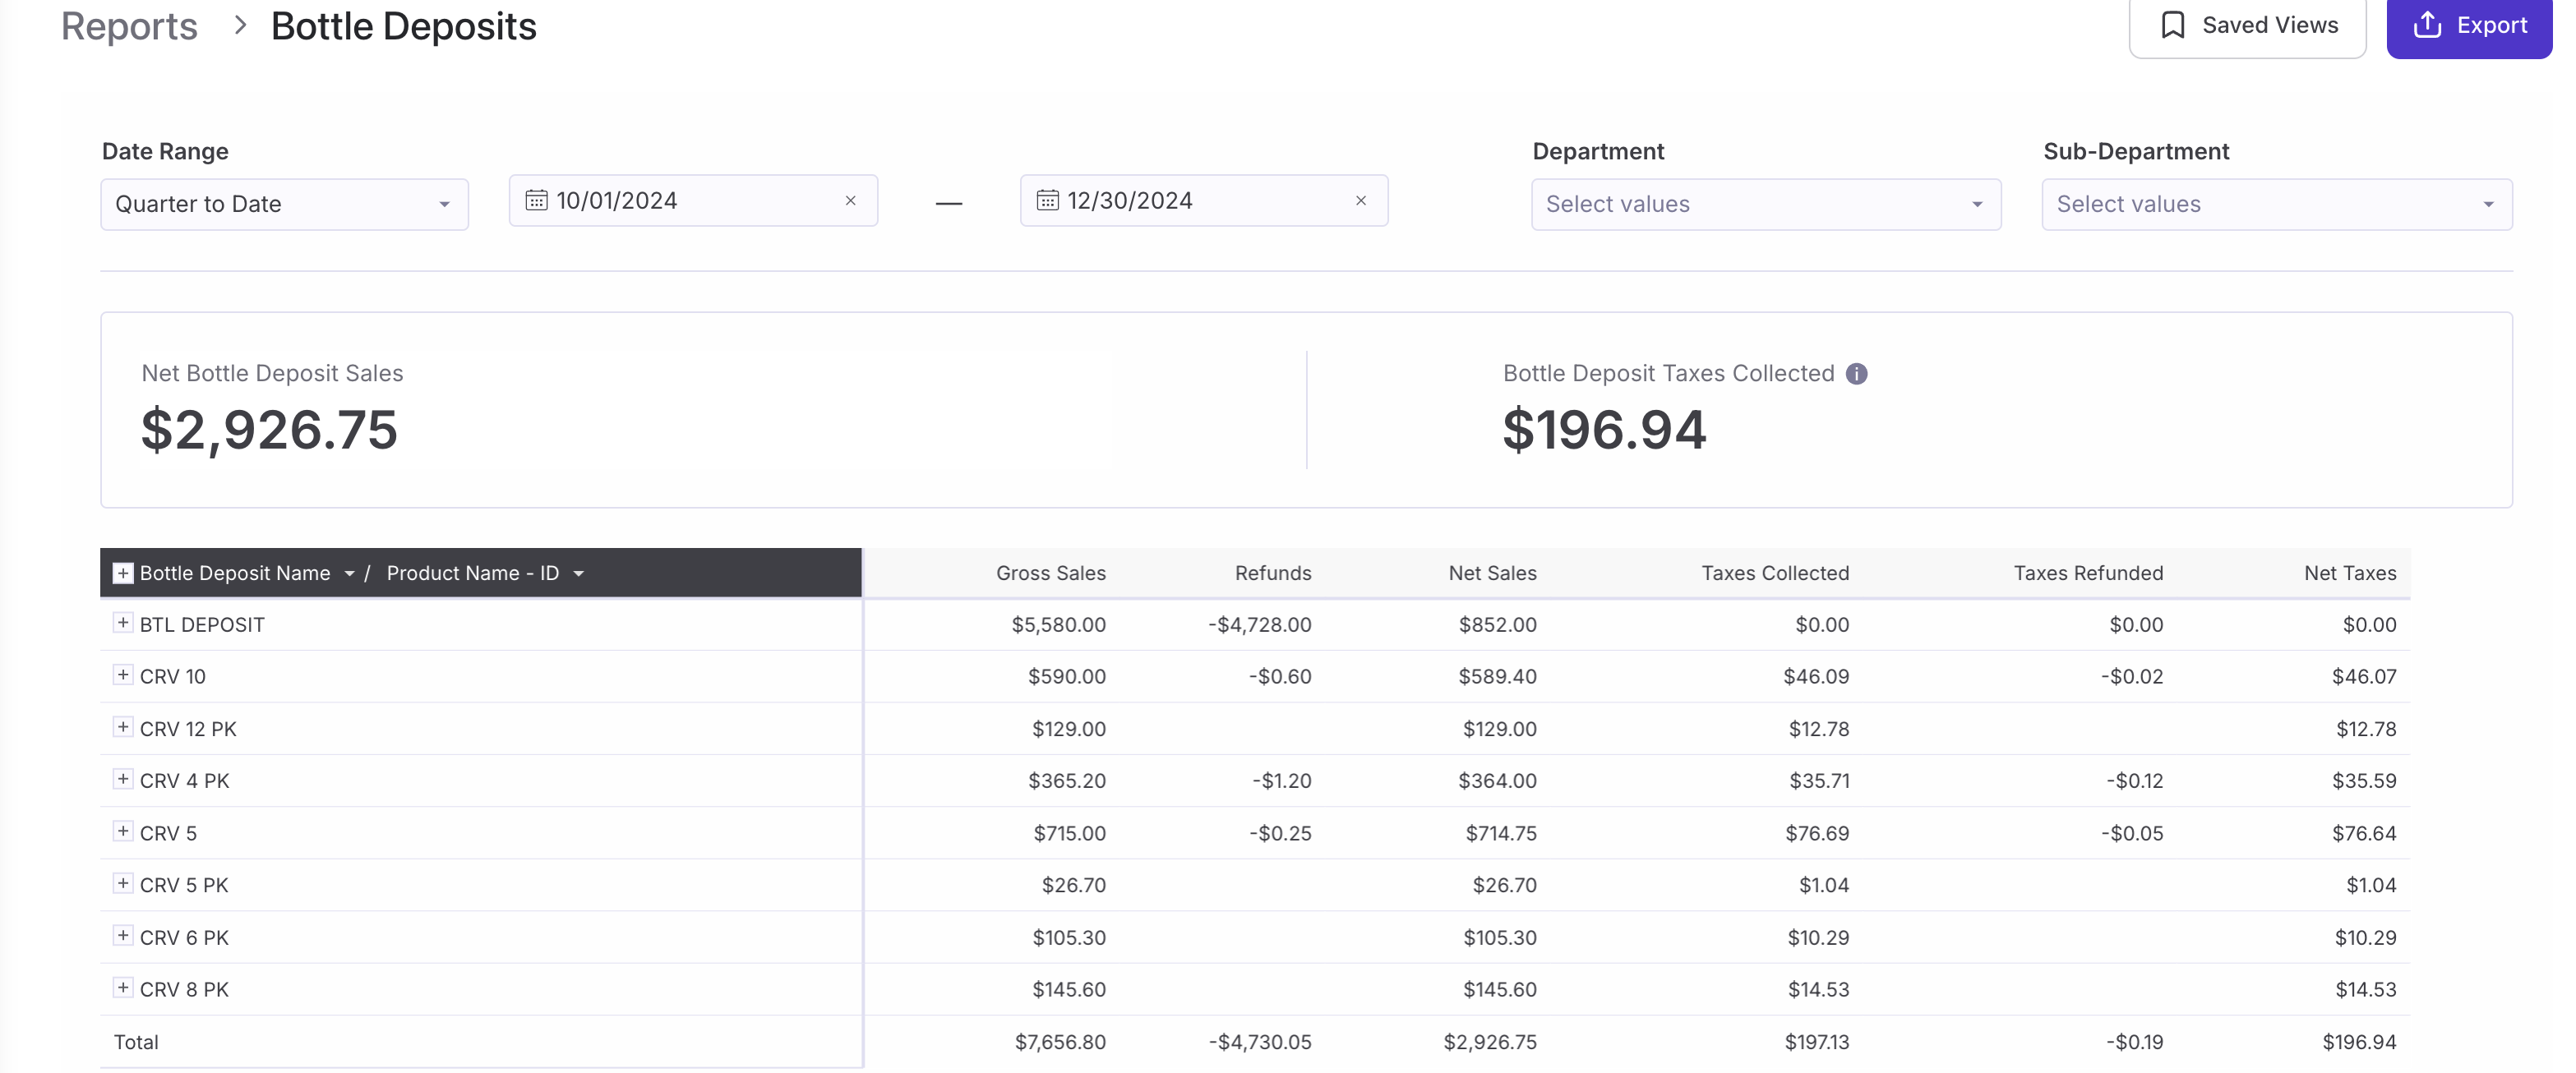
Bottle Deposits
This report will detail all bottle deposits collected and refunded, categorized by Bottle Deposit names.
Gift Cards
This report provides outstanding balance, active gift cards, deposits, redemptions, and BO adjustments over the selected date range.
House Accounts Overview
This report provides a comprehensive snapshot of house account activity and balances. It includes the total outstanding balance across all house accounts, daily sales activity tied to house accounts, and a breakdown of individual transactions.
In addition, the report highlights outstanding debts, account refunds, and any manual adjustments applied to house accounts. At the bottom, you’ll find a detailed table listing all house accounts, making it easy to review balances and activity by customer.
Inventory
Vendor Report Card
Monitoring vendor performance is essential for maintaining operational efficiency.
This report shows net sales, sales with costs, cost of goods sold and net margin. It also monitor orders placed on the Vori Ordering App, ordering volume, and invoices from vendors.
Purchase Orders
Follow along here for an an overview of the Purchase Orders report.
Products
This report offers a comprehensive overview of all items in the product catalog and can be exported in various file formats.
Inventory Levels
This report provides an in-depth analysis of the on-hand inventory levels for all products in stock. It also includes a comprehensive overview of the total inventory recorded in the store's product database, displaying both the current quantities available and the in-stock status for each item.
Inventory History
This report shows a detailed record of inventory changes over time, helping stores track and analyze inventory performance. It covers manual inventory adjustments, shrink and restock percentages, and provides an overview of the latest inventoried quantity for each inventory product.
In addition, the report includes detailed shrink reporting and inventory movement analysis, offering insights into patterns of loss, restocking trends, and overall inventory accuracy.
Vendor Item Sales
This report provides sales reporting specifically by vendor, focusing only on products that have an associated invoice cost. It includes unit, weight, and dollar sales and can be filtered by department and other report parameters. Use this report to track vendor-linked product performance and analyze profitability based on actual invoiced costs.
Point of Sale
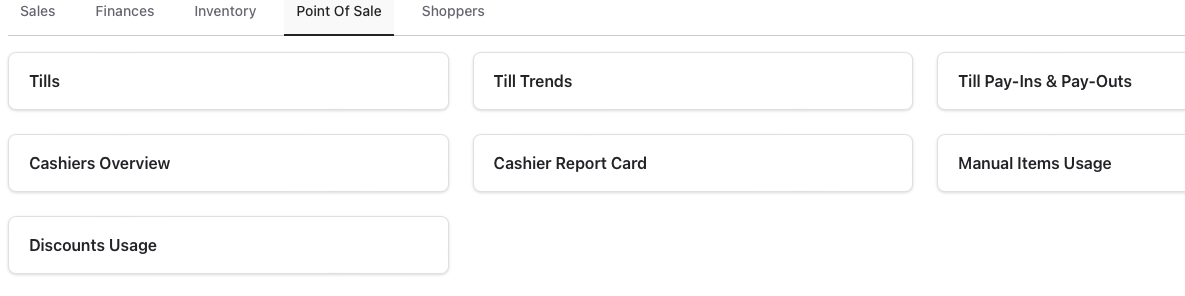
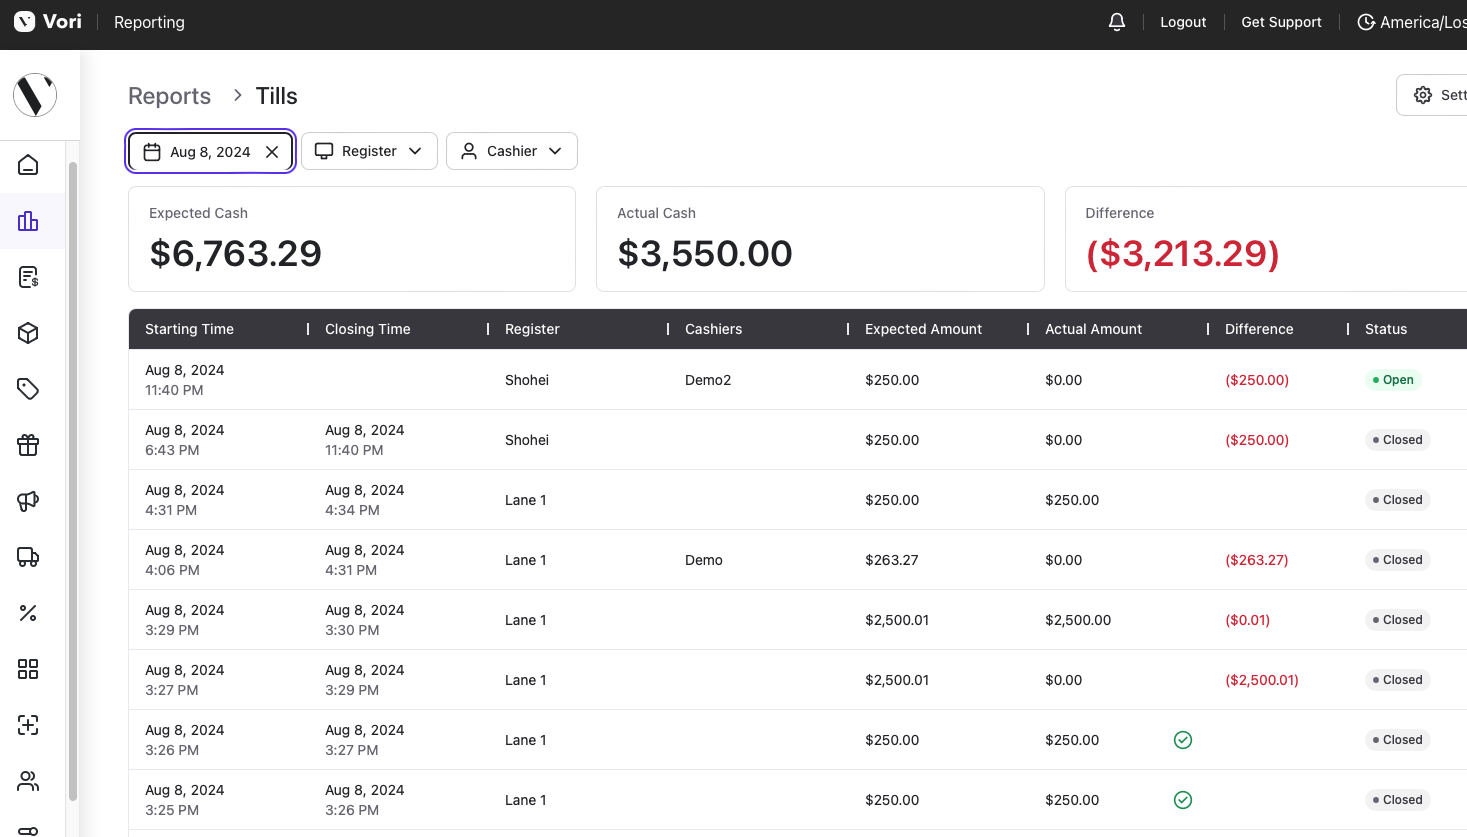
Tills
Reviewing till balances is crucial for ensuring financial accuracy and reconciliation.
Follow along here to view Tills in the Back Office.
Till Trends
This report will show Till Difference Trends and compares tills that have been reviewed and not reviewed. The Tills Details chart records information on till openings and closings, along with any discrepancies.
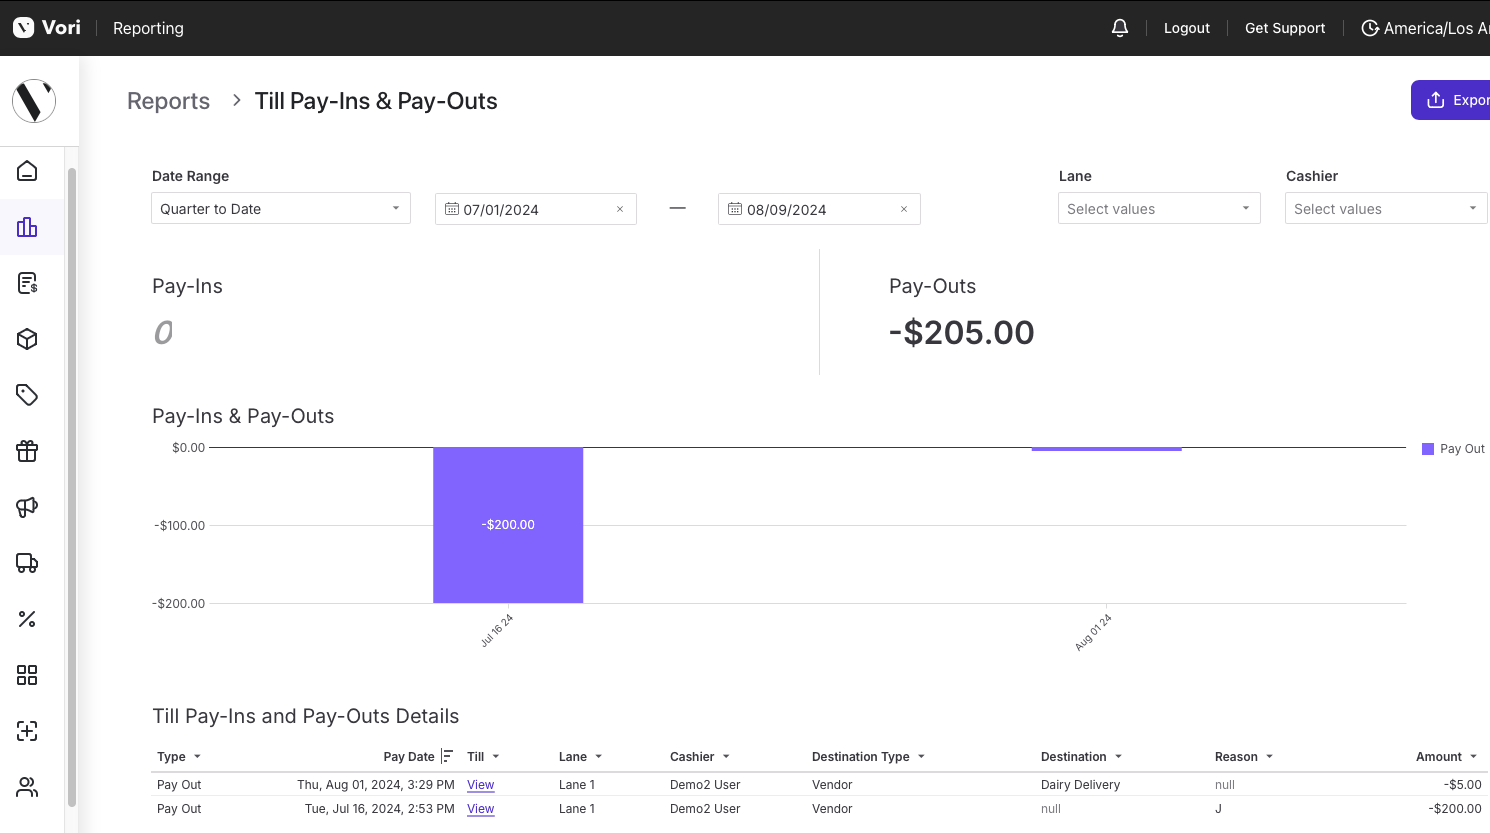
Till Pay-Ins & Pay-outs
This report includes data for all Pay-ins and Pay-outs over the selected date range.
It includes details on the timing of the transaction, the amount, and the reason or destination.
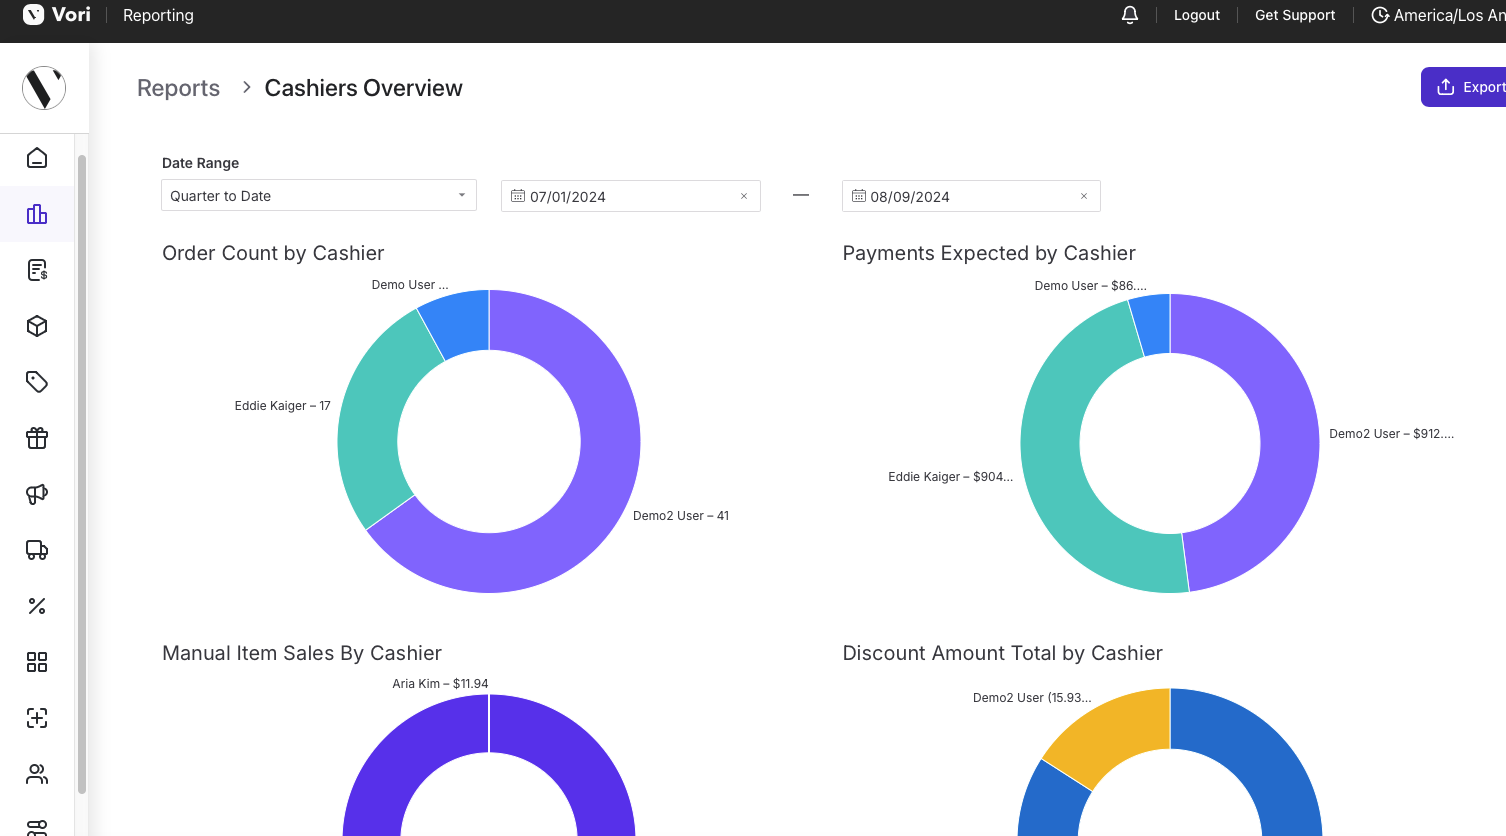
Cashiers Overview
This report gives an overall visual of cashier performance. Each graph presents metrics on employee productivity, manual item/discount usage, and a summary of sales and till activity for the selected date range.
✏️ Note - The next 3 reports are all linked to the Cashiers Overview Page
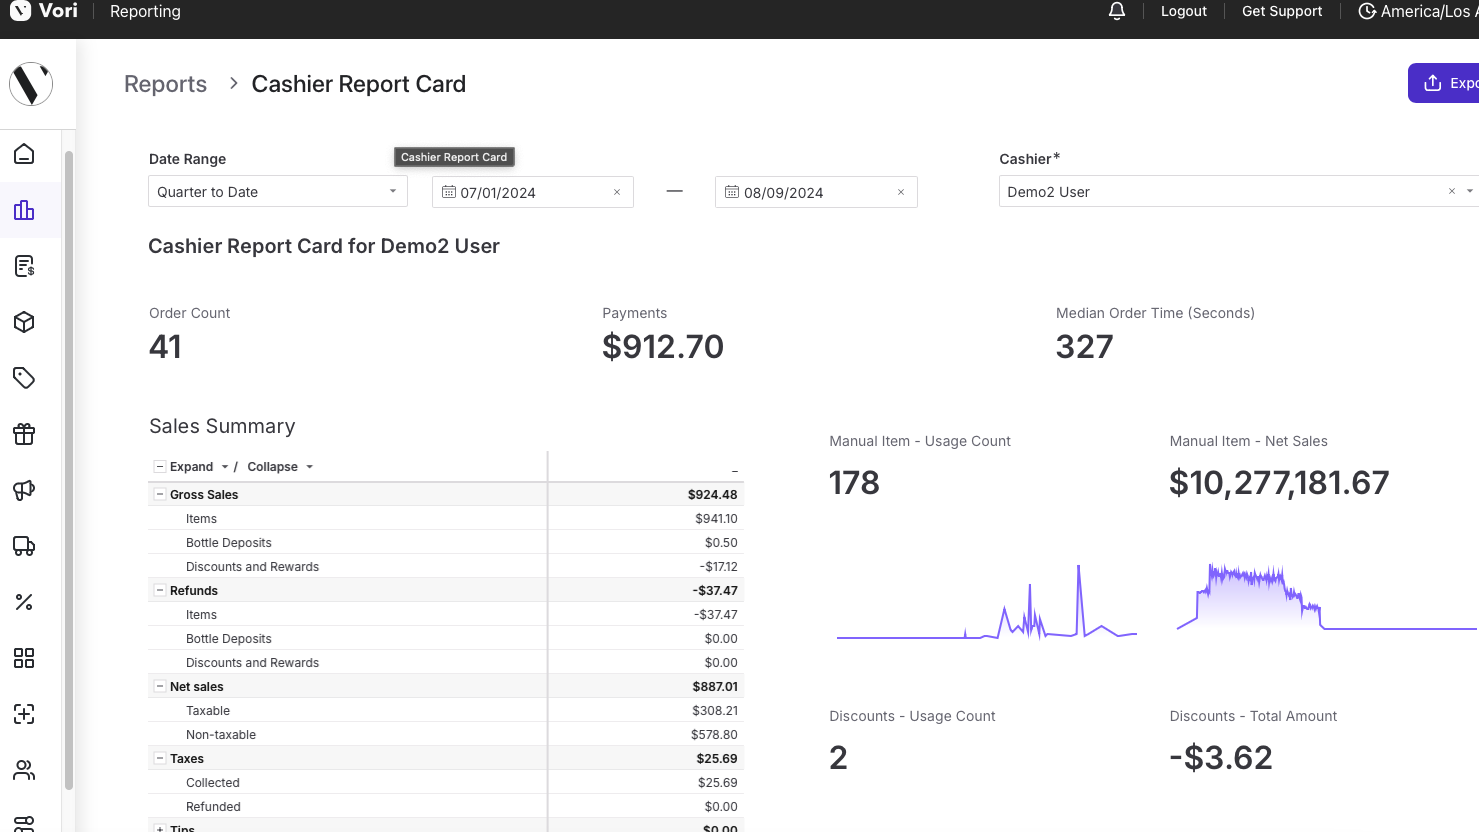
Cashier Report Card
A comprehensive summary of an individual cashier's performance for the chosen date range. This data is useful for identifying and addressing errors or trends in cashier performance.
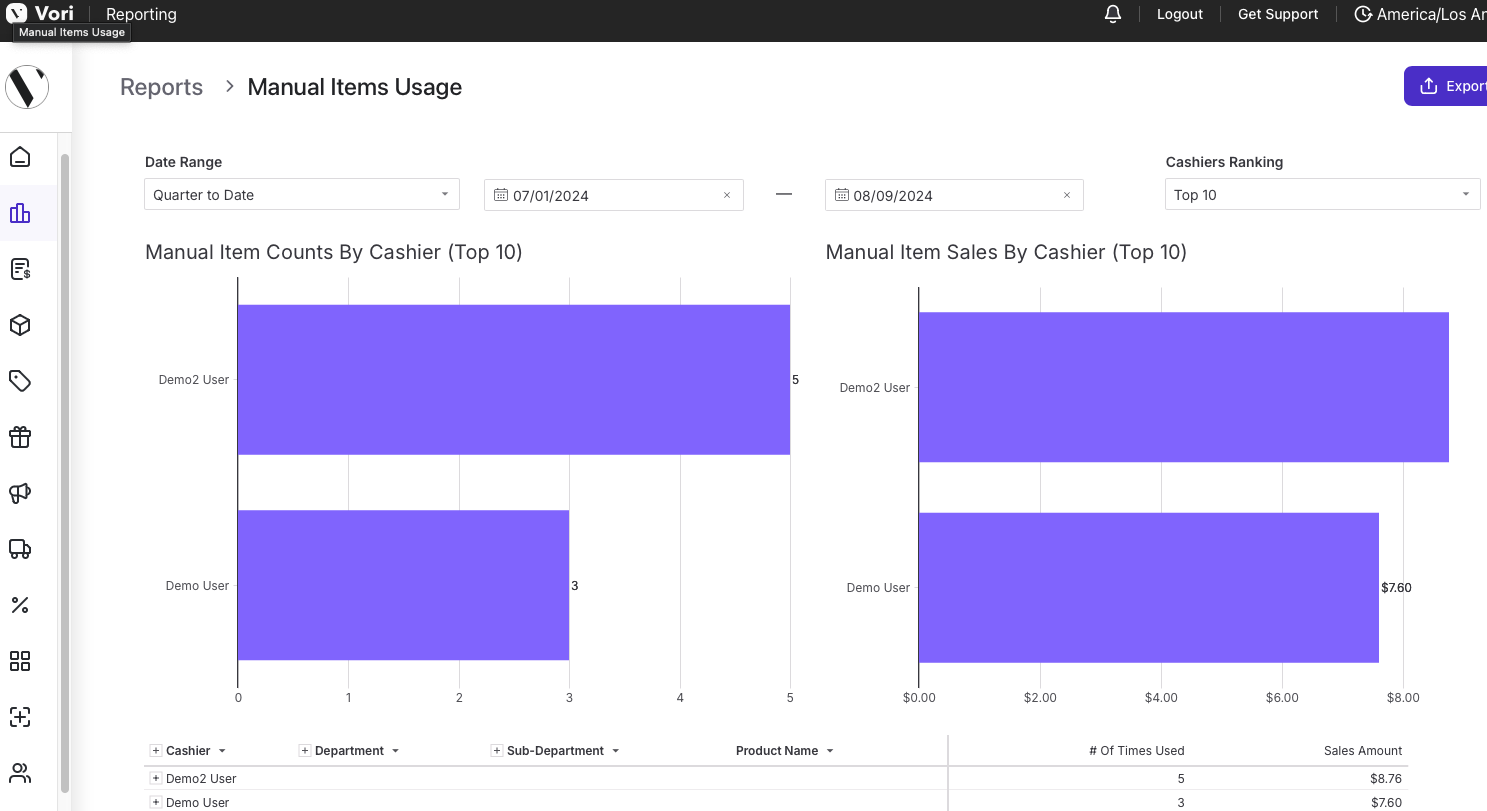
Manual Items Usage
This report provides data for Manual Items sold by each cashier over the selected date range. Tracking manual item sales made by a cashier is essential for maintaining accurate financial records.
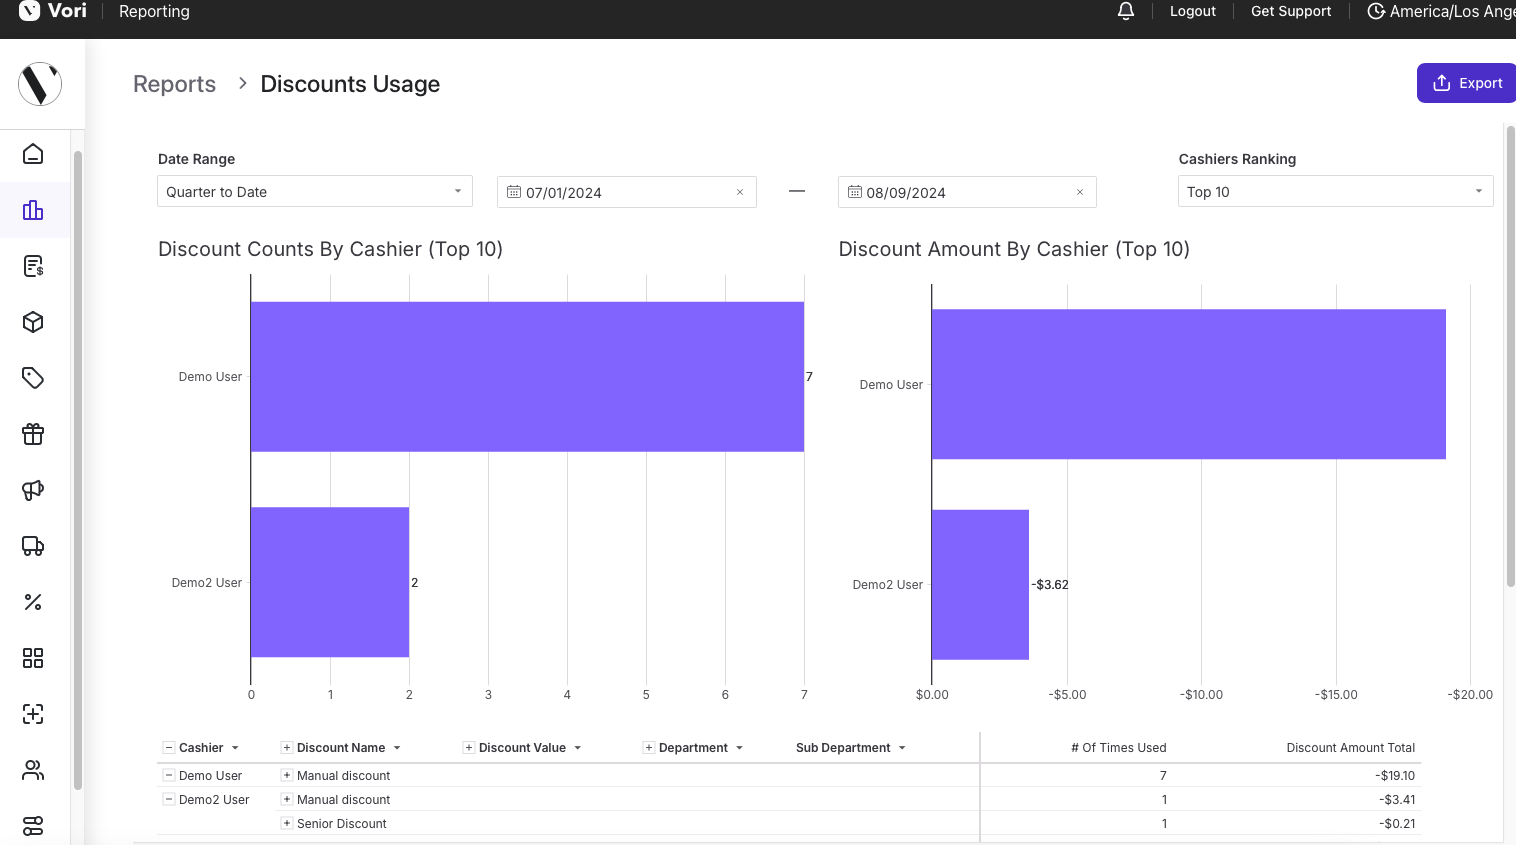
Discounts Usage
This report details all discounts applied by cashiers. The chart shows Discount Name, the # of times used, and the total discount amount. Reviewing this data will help ensure profitability and understand cashier behavior.
Shoppers
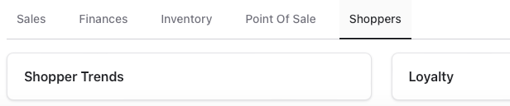
Shopper Trends
This report analyzes customer behavior, purchase frequency, and average basket size. It incorporates data from loyalty members as well as anonymized card fingerprint information.
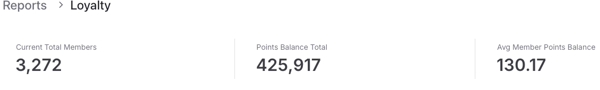
Loyalty
Viewing Loyalty metrics is crucial for businesses aiming to understand and improve customer retention and satisfaction. The top of the page displays the current total number of members, the cumulative points balance for all members, and the average points balance.
💡 Tip - Loyalty Insight provides a clear view of how loyalty impacts store sales.
These charts offer various visual comparisons of basket sizes and sales between loyalty members and non-members.
Campaigns
To view the impact of Campaigns, click here.
Additional Notes
-
Each report can be filtered by different date ranges.
-
 To export a report as a PDF, select Export button > Download.
 -
Follow along here for scheduling exports for reports.
-
For more detailed insights on a report, hover over the right-hand side, and select show underlying data.

Download a report as CSV or Excel Sheet
Directions
-
Hover over right-hand side of report.
-
 Select show underlying data.
 -
Tap
Download dataand select the preferred option.